By Theodore de Macedo Soares.
This article is part of the larger report by Election Justice USA.
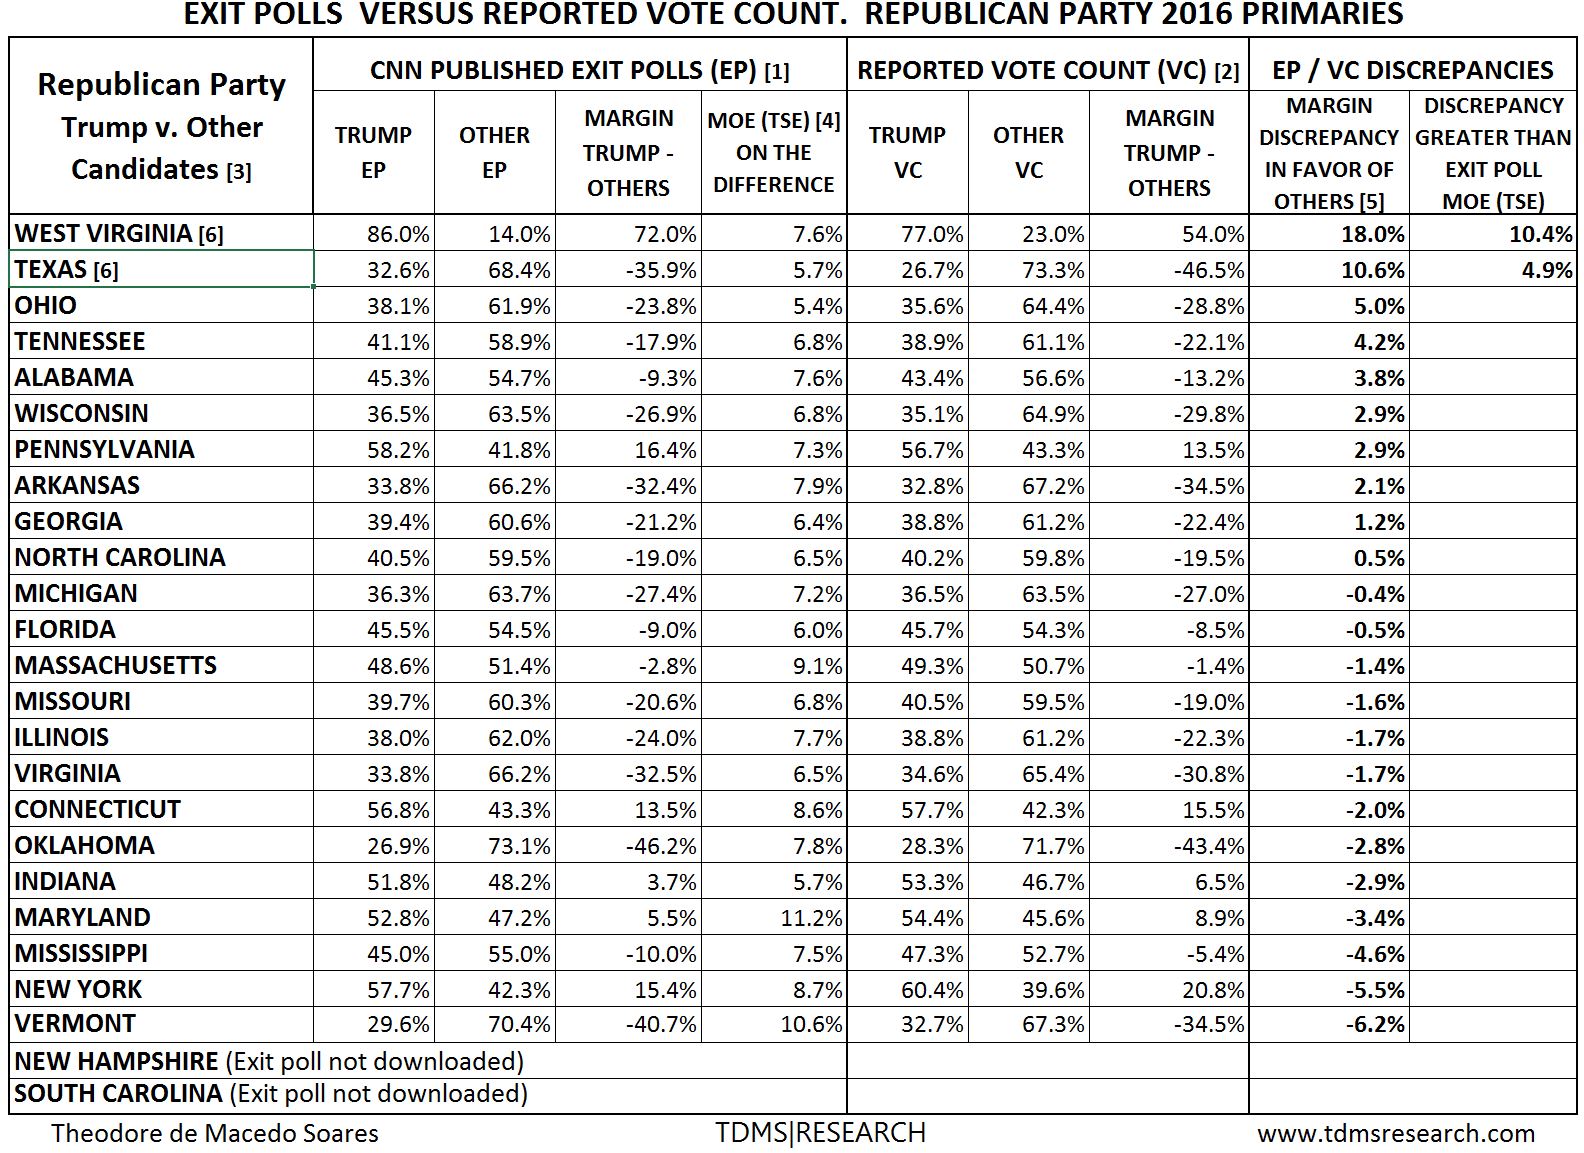
The computerized vote counts in the 2016 Democratic Party Presidential primaries have, in many states, differed widely from the vote totals predicted by the exit polls conducted by Edison Research. These discrepancies were overwhelmingly to Clinton’s benefit. The vote counts for the Republican Party Presidential primaries; however, with the exception of the primaries in two states, West Virginia and Texas, with very large discrepancies (18% and 10.6% respectively) going against Trump, have closely matched the results of their corresponding exit polls.
This section will examine the results of the exit polls and their disparities with computer vote counts; show that there is only one legitimate explanation why the exit polls for the two parties differed; and, lastly, show that the common attempts to explain away the discrepancies between computer vote counts and exit polls, fail for these primaries.
Why did the computerized vote counts only match the exit polls for the Republican Party Primaries and not for the Democratic Party primaries? More to the point, why does this question even arise?
In the United States computerized election vote counts are essentially unverified. Audits of any election, if conducted at all, are hidden from view— only four states specify that observers can verify the markings on the ballots[1] (only one state for primary elections).[2] Primary election results are only audited in 13 states.[3] Only six of these states require that the results of the audit and the data be made public.[4] Only one state, for any election,[5] is even experimenting with performing audits according to the best practices of a risk-limiting audit.[6]
To answer the second question posed above, as our computerized vote counts are non-transparent and largely unverified, the comparison of official vote counts with exit poll results is a standard method used to establish the veracity of election results. As USAID stated in their 2015 booklet “Assessing and Verifying Election Results”, [e]xit polls are powerful analytical tools … [a] discrepancy between the votes reported by voters and official results may suggest that results have been manipulated, but it does not prove this to be the case.”[7]
The 2016 Presidential Primaries: Exit Polls versus Reported Vote Counts
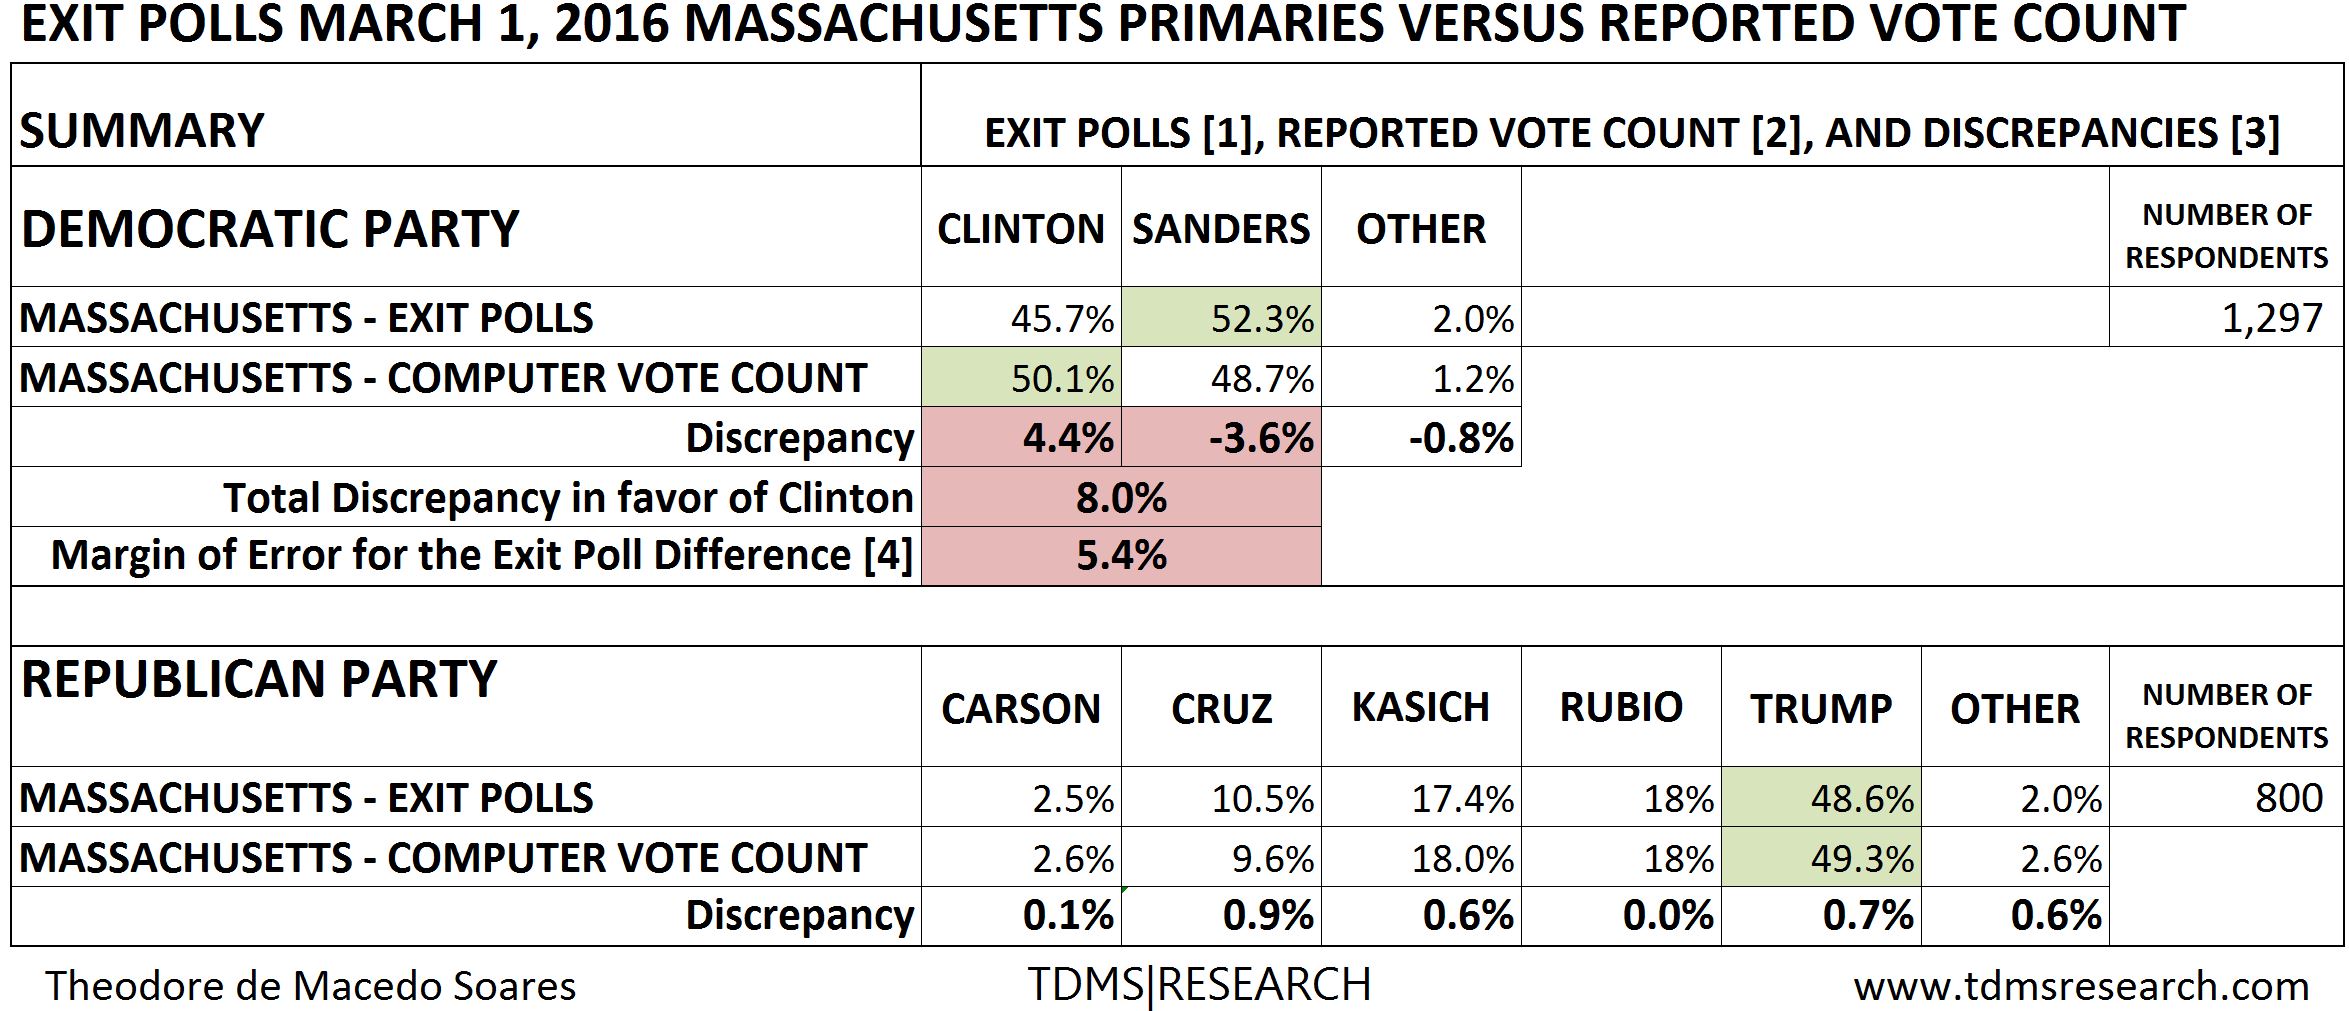
The unverified computer vote counts for these primaries differed widely from the Democratic Party exit polls but closely matched the Republican Party exit polls. Illustrative of the difference between the disparities found in the Democratic Party primaries and the lack of such disparities in the Republican Party primaries are the results from the Massachusetts primary.
 The explanatory notes for this table and associated article can be seen at: https://tdmsresearch.com/2016/06/14/the-suspect-massachusetts-2016-primary/
In the March 1, 2016 primary in Massachusetts, the exit polls projected a Sanders win by 6.6% and yet he lost by 1.4%, for a total discrepancy of 8%. The exit polls for the Republican Party race; however, closely agreed with reported vote totals with the largest discrepancy among the five candidates at less than 1%.[8]
This difference between the two parties is made remarkable by the fact that as in all primary states (for the exception of the primary in South Carolina where the Democratic Party and the Republican Party primaries occurred on different dates), the exit polls for both parties were conducted in the same precincts and at the same time,[9] with the same interviewers, and using the same methodologies.
The number of respondents is the primary determinant for the exit poll’s margin of error (MOE). Noteworthy is that the accuracy of the exit polls for the Republican Party, with 800 respondents, was achieved with about 500 less voters filling out the anonymous exit poll questionnaires than the Democratic Party with 1,297 respondents.
To answer the first question: Why did the computerized vote counts only match the exit polls for the Republican Party Primaries and not of the Democratic Party primaries?
As the exit polls for both parties were conducted at the same places and times variations in the conduct of the exit poll cannot explain the difference between the exit polls of both parties. The usual assertion that exit polls may be wrong because respondents, more enthusiastic for a particular candidate, would more likely to agree to be polled also does not apply to these elections. Similar to the many Democratic Party voters demonstrating enthusiasm for candidate Sanders, Republican Party voters demonstrated a great deal of enthusiasm for candidate Trump (see section Addressing Criticisms of Exit Polls below for a more detailed examination of this claim). Thus, we would expect to see consistent exit polling results that were greater than the computer vote count for Trump if this explanation held true, which in fact was not the case.
The only remaining explanation is that computers were accurately counting the votes in the Republican Party primaries but not in the Democratic Party primaries. No other explanation appears to be viable.
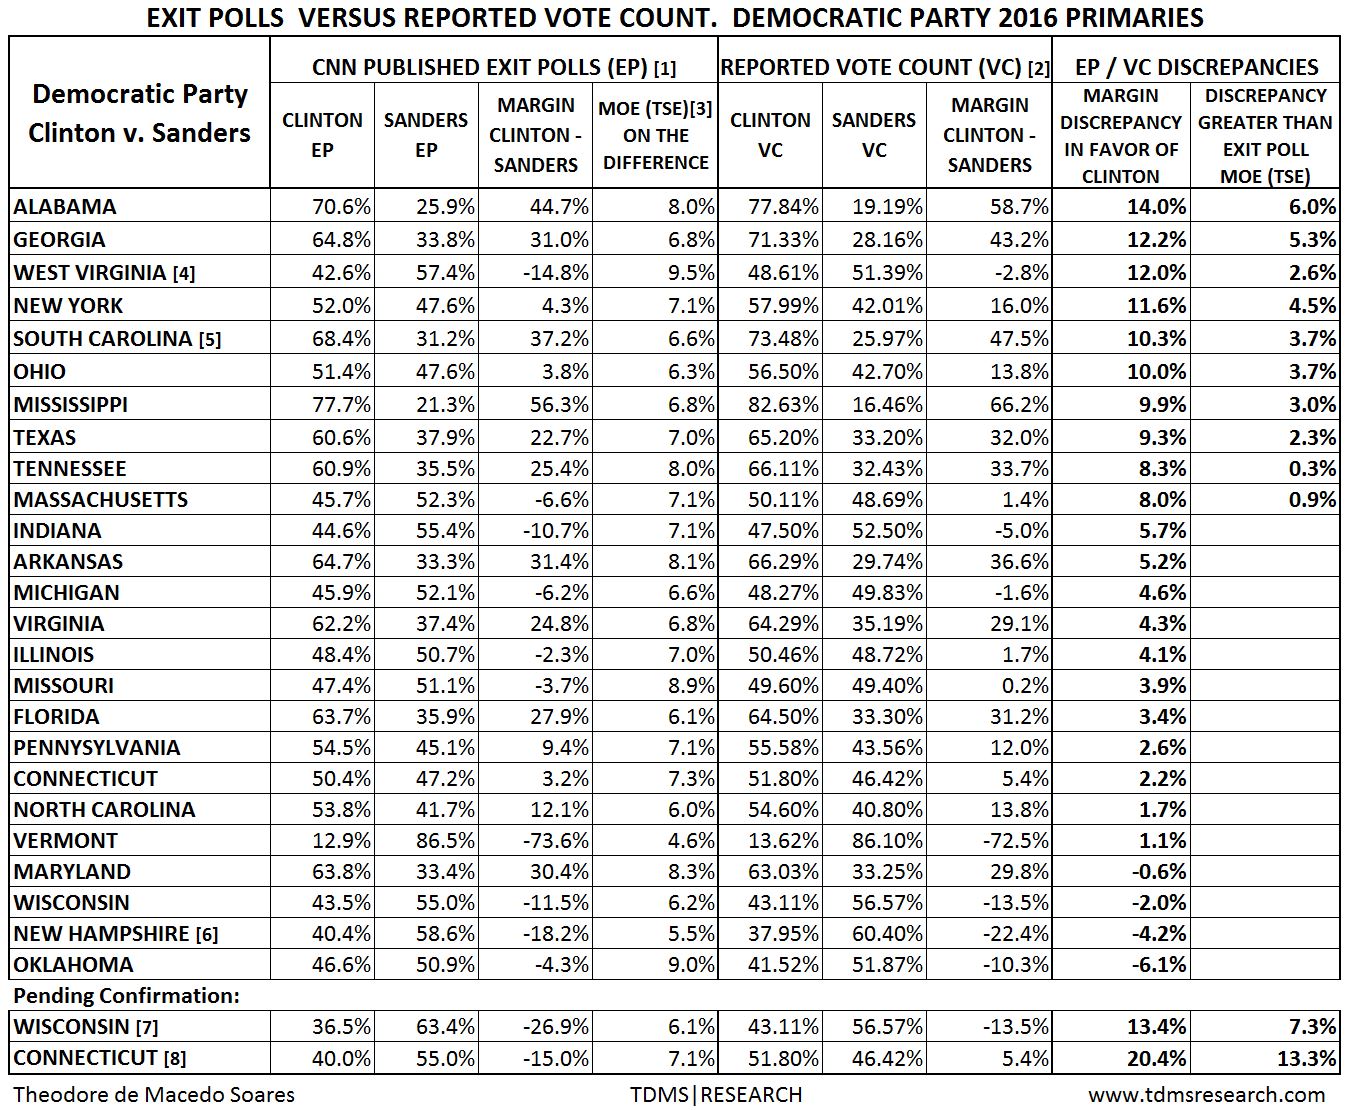
The Massachusetts story is repeated in other 2016 presidential primary states. As the Democratic Party primaries table below demonstrates, in 21 of 25 primary states for which exit polls were conducted, the unverified computer count totals differed in one direction—in Clinton’s favor. In ten of these primary results, the discrepancies exceeded the augmented margin of error (MOE) for their respective exit polls (see discussion below for an explanation of the augmented MOE applied). In sharp contrast, the discrepancies in the Republican Party primaries were as likely to favor Trump as the other candidates (13 and 10 respectively).
 The explanatory notes for this table can be seen at: https://tdmsresearch.com/2016/06/20/democratic-party-table-2016-primaries/
With the exception of the primaries in two states, West Virginia and Texas, that saw very large discrepancies (18% and 10.6% respectively) going against Trump, the Republican Party races exhibited what should be expected with impartial vote counts and exit polls; sometimes the discrepancies favored Trump, and sometimes went against him. The average of the discrepancies favoring Trump was 2.7%. The average of the discrepancies going against Trump, excluding West Virginia and Texas, was almost identical at 2.8%. These averages discrepancies, less than half of the average of their margin of error (7% and 8% respectively), demonstrate that indeed, exit polls can be very accurate.
 The explanatory notes for this table can be seen at: https://tdmsresearch.com/2016/06/20/republican-party-table-2016-primaries/
In the Democratic Party primaries, among the 21 primary states where the discrepancies between the exit poll and the vote count favored Clinton the average discrepancy was 6.9%. The top ten averaged a large discrepancy of 10.6%. The average of the four discrepancies favoring Sanders was 3.2%.
Discrepancies between Computer Counts and Exit Polls Likely Larger
To understand why the exit polls may have substantially underestimated Sanders’ projected vote totals in many of these states, it is important to understand the mission of Edison Research, the firm that conducts exit polls for the major news networks. As widely stated, their purpose is to supply accurate estimates of electoral outcomes, including the demographics and opinions of the electorate to inform the networks and through them, the public. Edison Research assumes the computer vote counts are correct and their mission is successfully accomplished when their estimates match the official computer vote counts.
For this reason, the first published exit polls are progressively altered to conform to the incoming computer vote counts until all discrepancies between the first published exit polls and the final computer vote counts are reduced to approximately zero. Only these exit polls, now matching the final vote counts, are presently available to the public on the various networks websites.
To fulfill their mission Edison Research conducts the exit poll surveys according to the well-established science common to all surveys including exit poll survey methodology scientifically honed through decades of practice. As a necessary part of estimating the electoral results they also include the results of their telephone surveys of absentee/early voters which in some states may be a significant part of the electorate.
The reason Edison Research may have actually underestimated candidate Sanders exit poll results in many of the primary states is that their scientifically conducted exit polls estimates are further modified with the “aggregate of pre-election polls…[and] actual vote returns from sample precincts and county vote returns as provided by the Associated Press and location election officials.”[10]
The Effect of Pre-election Polls
The reason the inclusion of pre-election polls may have resulted in underestimating Sanders’ exit poll results is that in 19 of the 25 primary states the aggregate of the pre-election polls[11] conducted within a week or so of the election of each primary state, projected a lower margin for Sanders than projected by the first exit polls published by the networks. In thirteen of these states the under projection was large with an average of 11%. A large miss is illustrated by the pre-election polls prior to the primary in Michigan on March 8, 2016. The average of the aggregate pre-election polls from March 1-7 had Sanders losing by 22%. The losing margin increased to 29% in the period March 4-7.[12] The exit polls; however, projected a Sanders’ win by 6.2% and the final vote count had Sanders winning by 1.6%.
Without access to Edison’s raw exit poll data it is unknown how much weight or percentage points they subtracted from Sanders’ exit poll results in order to more closely conform to the pre-election polls. Assuming, for illustration purposes, that Edison had subtracted half of the average March 1-7 pre-election polls (11%) from Sanders’ exit poll results the actual exit poll totals for Sanders would have shown a winning margin of 17.6%. The resulting discrepancy with the computer count would have been a whopping 16% instead of the 4.6% shown using the adjusted exit polls
As another example, the March 4-13 pre-election polls for the Ohio primary on March 15, 2016 averaged a Sanders’ loss by roughly 14%.[13] Similar calculations as above would have yielded an exit poll showing Sanders winning this state by 3.2% and the resulting discrepancy with the unverified computer vote count showing a Sanders loss by 13.8% would have been another whopping 17% instead of the already large discrepancy of 10% using the adjusted exit polls.
Again, these illustrations depend on how much weight Edison applied to these pre-election polls, which could have been more or less than the examples illustrated above. As the pre-election polls, however, generally underestimated Sanders’ exit polls’ electoral strength the majority of the discrepancies going against Sanders were likely larger than shown using the adjusted exit polls. The discrepancies favoring candidate Sanders may have instead favored Clinton.
The Effect of Vote Counts
As Mr. Lenski of Edison Research explained, when states such as “New Hampshire, Kentucky, Indiana, Florida and Texas (and others) have split poll closing times where part of the state closes at one time and the rest of the state closes at a later time…we may have quite a bit of actual vote returns to use in our estimates that are broadcast…when all of the state polling locations have officially closed.”[14] Although Mr. Lenski did not explicitly state that in other states without split closing times they also used vote returns acquired from the precincts they were polling or from other sources, there seems no reason why Edison would not use them if available.
The problem with altering exit polls with vote returns from computer counts that overwhelmingly favored Clinton compared to the states’ exit polls is that such returns would have depressed Sanders’ exit poll totals even further, resulting in an even larger discrepancy between the exit polls and the vote counts. When one adds the effect of pre-election polls the resulting combined discrepancies may have been very large indeed.
Take Texas, for example, a state with split poll closing times. The exit polls had Sanders losing the state by 22.7%. The unverified computer vote count resulted in a 32% Sanders loss. The question becomes how much of the 22.7% of Sanders losing exit poll totals had been bumped up to match the incoming vote totals from this state? If the 22.7% exit poll total had been bumped up by, say, 10% to come closer to the incoming votes it means that the exit poll with the pre-election poll adjustment was actually 11.7%. The RCP pre-election polls averaged a Sanders loss by 30.3%.[15] If a hypothetical 15% of the pre-election polls had been included to increase his loss margin to come closer to the pre-election polls it is then possible that Sanders unadjusted exit poll may have even projected him winning the state of Texas by 3%. The large existing discrepancy of 9.3% between the exit polls and the computer vote counts would have instead been a mammoth 35%.
Of course, all these calculations are hypothetical. Without access to the raw exit poll data from Edison Research with a detailed accounting of the adjustments made, these calculations will have to remain as speculations. They are presented as illustrations of the possibility that the first exit polls published by the networks soon after the closing of the polls for the state may have significantly understated Sanders’ electoral strength. The actual scientifically conducted exit polls may have shown much greater totals for candidate Sanders and may have even shown that he handily won the 2016 Democratic Party primary contest against candidate Clinton.
Addressing Criticisms of Exit Poll
Determining Total Survey Error
Exit polls like all surveys are susceptible to the following possible sources of error: Coverage error (not able to sample a selection of the population), nonresponse error (not able to poll all persons in the chosen sample), sampling error (when the survey sample is different than the population being measured), and measurement error (from inaccurate responses).[16]
The results of surveys of all kinds, such as the pre-election polls referenced in this section, are generally published with an associated margin of error that is primarily associated with the sample size—the larger the sample, the smaller the margin of error. The other possible sources of error, difficult to quantify and formulate mathematically are almost always left unaddressed. The fact that exit polls are singled out for this fault does not diminish the validity of this observation.
The best approach would be to determine the total survey error (TSE) for any given survey. If the actual population values being measured were known then the results of the survey could be compared to determine how close the sample-based survey came to these values. The resulting margin of error for all the possible sources of error could then be determined. This was the approach taken in the margin of error that was applied to both the Democratic and Republican Party primaries.
Exit polling for the Republican Party primaries, as noted above, was fairly accurate with only two states exhibiting suspiciously large discrepancies (Texas at 10.6% and West Virginia at 18%) going against Trump. Excluding these anomalous and suspicious results from the calculations the Republican Party primaries yielded 106 separate exit poll results for the six main candidates (Trump, Cruz, Kasich, Rubio, Carson, and Bush). To determine the total survey error their exit poll survey estimates were compared to their vote totals.[17] This comparison determined that by increasing the standard statistical margin of error by 32%, the percentage of exit polls exceeding this augmented MOE was 4.76% (5 of 106) which is just under the expected 5% in an exit poll with a confidence interval of 95%. Accordingly, this increased MOE represents the total survey error of the exit polls for the Republican Party primaries.
As mentioned above, since in all primary states (with the exception of South Carolina) the exit polls for both parties were conducted in the same precincts, at the same time, with the same interviewers, and using the same methodologies, the increased MOE also represents the total survey error for the Democratic Party primaries.
The bottom line: the Republican Party Primaries had two states exhibiting large discrepancies exceeding the total survey error, whereas the Democratic Party primaries had 10 states that exceeded the TSE. Since all the potential sources of error common to surveys including exit polls are accounted for with the application of this augmented margin of error, the current use of these exit poll results to assess the veracity of the unverified computer vote counts should be harder to criticize.
Youthful Voters not the Cause of Discrepancies between Exit Polls and Computer Counts
Nate Cohn, a writer for the New York Times, recently wrote an article theorizing that the reason “why…exit polls so tilted toward Mr. Sanders,” was due to the fact that “young voters are far likelier to complete the exit polls than older voters.” Although he acknowledged that Edison Research corrects for this usual and well known fact, Mr. Cohn asserts that their correction “falls short.”[18]
Mr. Cohn’s assertion is a variation of the popular criticism of exit polls that centers on nonresponse error as the cause for the discrepancies between the exit polls and the final vote count—the voters of a particular candidate may be overrepresented because they are more enthusiastic for their candidate and thus more willing to fill out the exit poll’s anonymous questionnaires than the voters for another candidate. This criticism is generally put forth without any evidence and has been refuted as the explanation for the discrepancies in previous elections. [19] Additionally, Edison Research works very hard to reduce such errors by taking note of the characteristics of the nonresponders, such as their gender and age range, and adjust their exit polls results accordingly. [20]
According to Mr. Cohn, the discrepancies between the exit polls and the computer vote counts that in 21 of 25 states favored Clinton were caused by an overrepresentation of younger voters in the exit polls. As younger voters overwhelmingly voted for Sanders, the theory goes, the alleged uncorrected higher proportion of younger voters participating in the exit polls distorted the exit polls in Sanders’ direction.
Actual 2016 Democratic Party primaries data does not support Cohn’s theory:
(1) The proportion of youthful voters in these primaries had no correlation with the discrepancies between the exit polls and the unverified computer vote counts that favored candidate Clinton.
(2) The enthusiasm of youthful voters for candidate Sanders had no correlation with the proportion of youthful voters in the different states.
(3) Higher proportions of youthful exit poll respondents voting for Sanders, instead of correlating with higher discrepancies, actually correlates with lower discrepancies; the opposite of what would hold according to Cohn’s asserted explanation for the discrepancies.
Doug Johnson Hatlem, in an article published in CounterPunch, pushed back on this theory by noting that states such as Alabama, Georgia, Ohio, and South Carolina with lower proportions of young voters, had high discrepancies between the exit polls and vote counts favoring Clinton while states such as North Carolina, with higher proportions of young voters, had small discrepancies.[21] Here, in the following first graph, the observations of Mr. Hatlem are extended to include the Democratic Party primaries of all states for which exit polls were conducted.
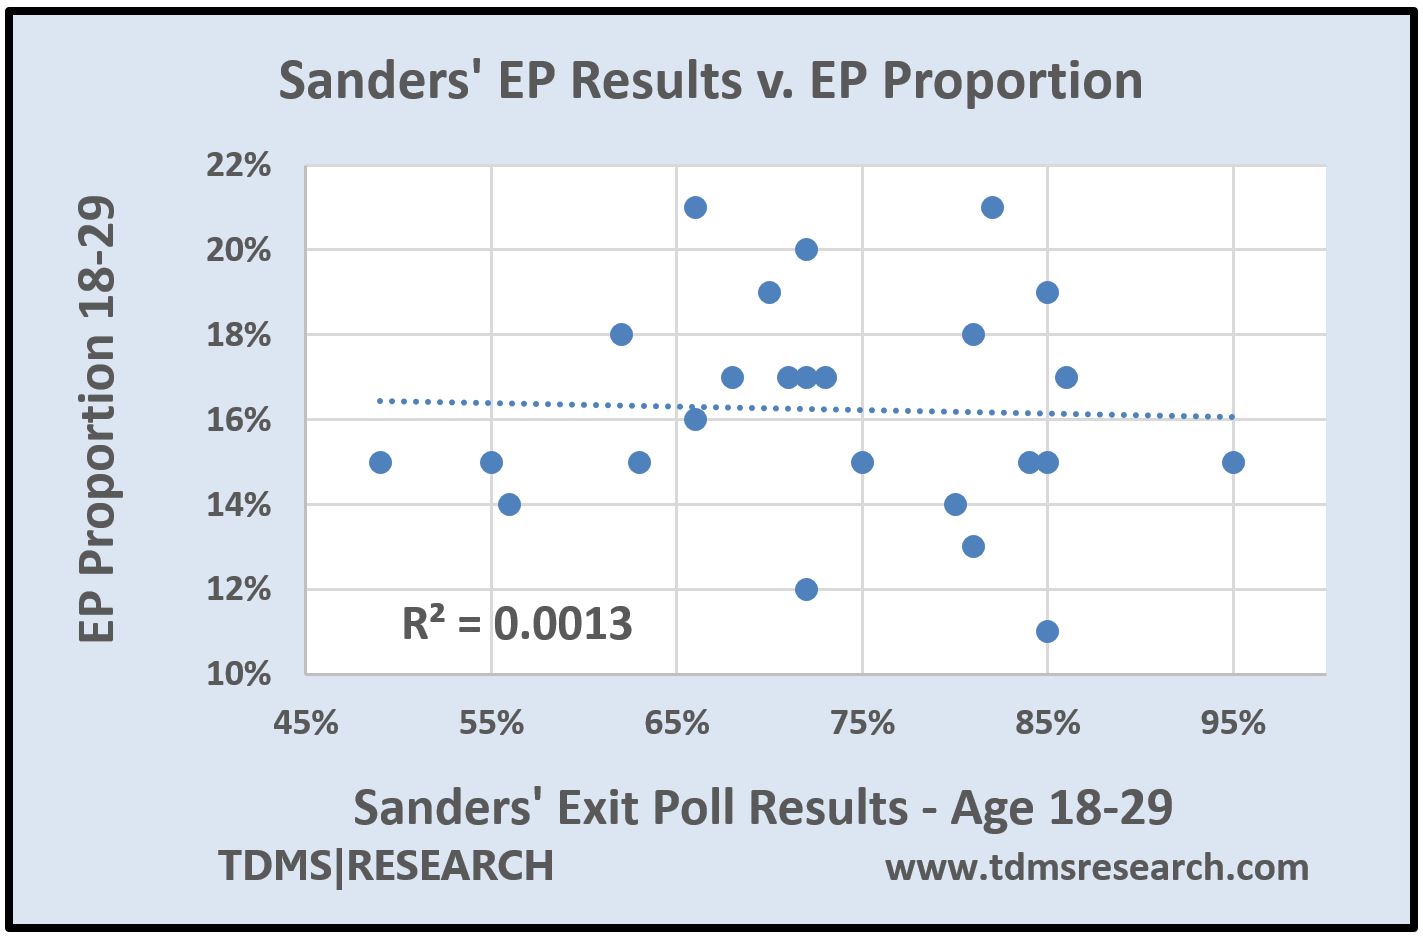
(1) If Mr. Cohn is correct then one should see a clear correlation between the proportion of youthful voters and the discrepancies—the greater the proportion of younger voters in the exit poll, the greater the discrepancy. Actual data, however, shows that there is near zero correlation between the proportion of exit poll responders age 18-29 and the discrepancies found in the 25 primary states for which exit polls were conducted:
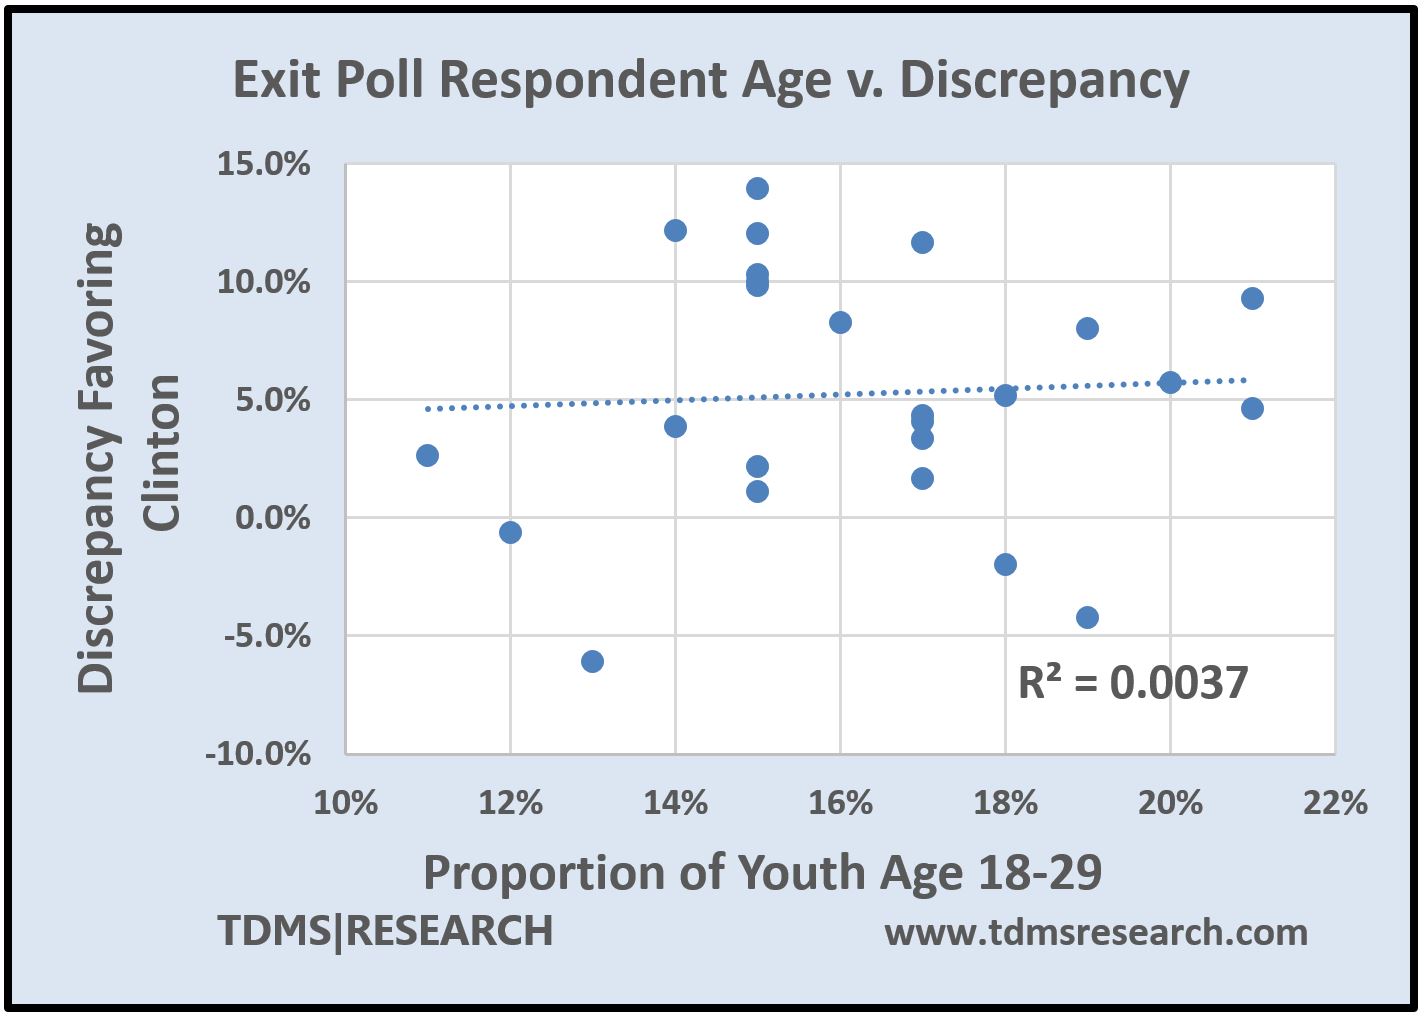 Each dot on the graph represents exit poll data for a state in the 2016 Democratic Party primaries. The leftmost dot, for example, represents the results of the primary election in Pennsylvania. The dot marks the proportion of voters age 18-29 at 11% on the horizontal x-axis and the discrepancy between the exit poll and the computer vote count at 2.6% on the vertical y-axis. The first thing to notice is that the linear trend (the dotted line) is almost horizontal indicating no relationship between the increasing proportion of youth and the increasing discrepancies in the various states. The second thing to notice is that the dots are widely scattered around the trend line. If there were a strong positive correlation, the dots would be bunched close to the trend line and it would be pointing steeply upwards; showing that greater proportions of youthful voters resulted greater discrepancies in favor of Clinton.
This chart shows that as the proportion of voters aged 18-29 increases in 25 primary states, there is almost no increase in the discrepancies between the exit polls and the unverified computer vote counts. As the results for every state are spread-out in the graph there is also a near zero (R =0.061) correlation between the proportions of this age group in the various states and the discrepancies. The proportion of the discrepancies that can be explained by the proportion youthful voters is also almost zero at 0.37% (R2=0.0037). Contrary to Mr. Cohn’s theory, the proportion of youthful voters represented in the exit polls is not correlated with the exit polling discrepancies and does not explain why Democratic candidate Sanders’ computer vote counts were so much less than predicted by the exit polls in so many states.
Increasing the age range to 18-44 also does not support Mr. Cohn’s assertions: there is a near zero (R=0.074) correlation between the discrepancies of the exit polls with the unverified computer vote counts. The proportion of the discrepancies that can be explained by the proportion of youthful voters is also almost zero at 0.55% (R2 =0.0055; graph not shown).
(2) If Mr. Cohn is correct the higher level of youthful enthusiasm for Mr. Sanders should result in larger proportions of youthful voters participating in the exit polls in the different states. Actual data, however, shows that there is near zero correlation between the enthusiasm of youthful voters and their proportion in the exit polls for all states.
 This chart shows that as the enthusiasm level increased for Mr. Sanders—as his share of the youth vote increased among exit poll respondents—there was no accompanying increase in the proportion of youthful exit poll respondents. In Mississippi (represented by the leftmost dot), for example, Sanders received 49% of the exit poll vote of the respondents age 18-29 while the proportion of this age group participating in the exit poll was estimated at 15% by Edison Research. In contrast, Vermont (represented by the rightmost dot) with the same proportion of youthful voters (15%) had 95% of this age group stating they voted for Sanders. Similar to the chart above, the almost horizontal trend line shows no correlation between the increasing exit poll vote share for Sanders and the increasing proportions of youthful voters.
Increasing the age range to 18-44 also does not support Mr. Cohn’s assertions: there is a near zero (R2 =0.0042) relationship between the level of enthusiasm for this extended age group and their proportions in the exit polls of various states (graph not shown).
Contrary to Mr. Cohn’s theory, the level of enthusiasm for Mr. Sanders was not at all correlated with any increase in the proportion of youthful voters in the exit polls.
(3) Finally, If Mr. Cohn’s and the standard explanation for vote count/exit poll discrepancies is correct, higher levels of youthful enthusiasm for candidate Sanders should result in them being more willing to fill out the exit poll questionnaires and thus increase the discrepancies between the exit poll predictions and the unverified computer vote counts. Actual data, however, shows just the opposite: as Senator Sanders share of the youth vote among exit poll respondents increased, the discrepancies decreased.
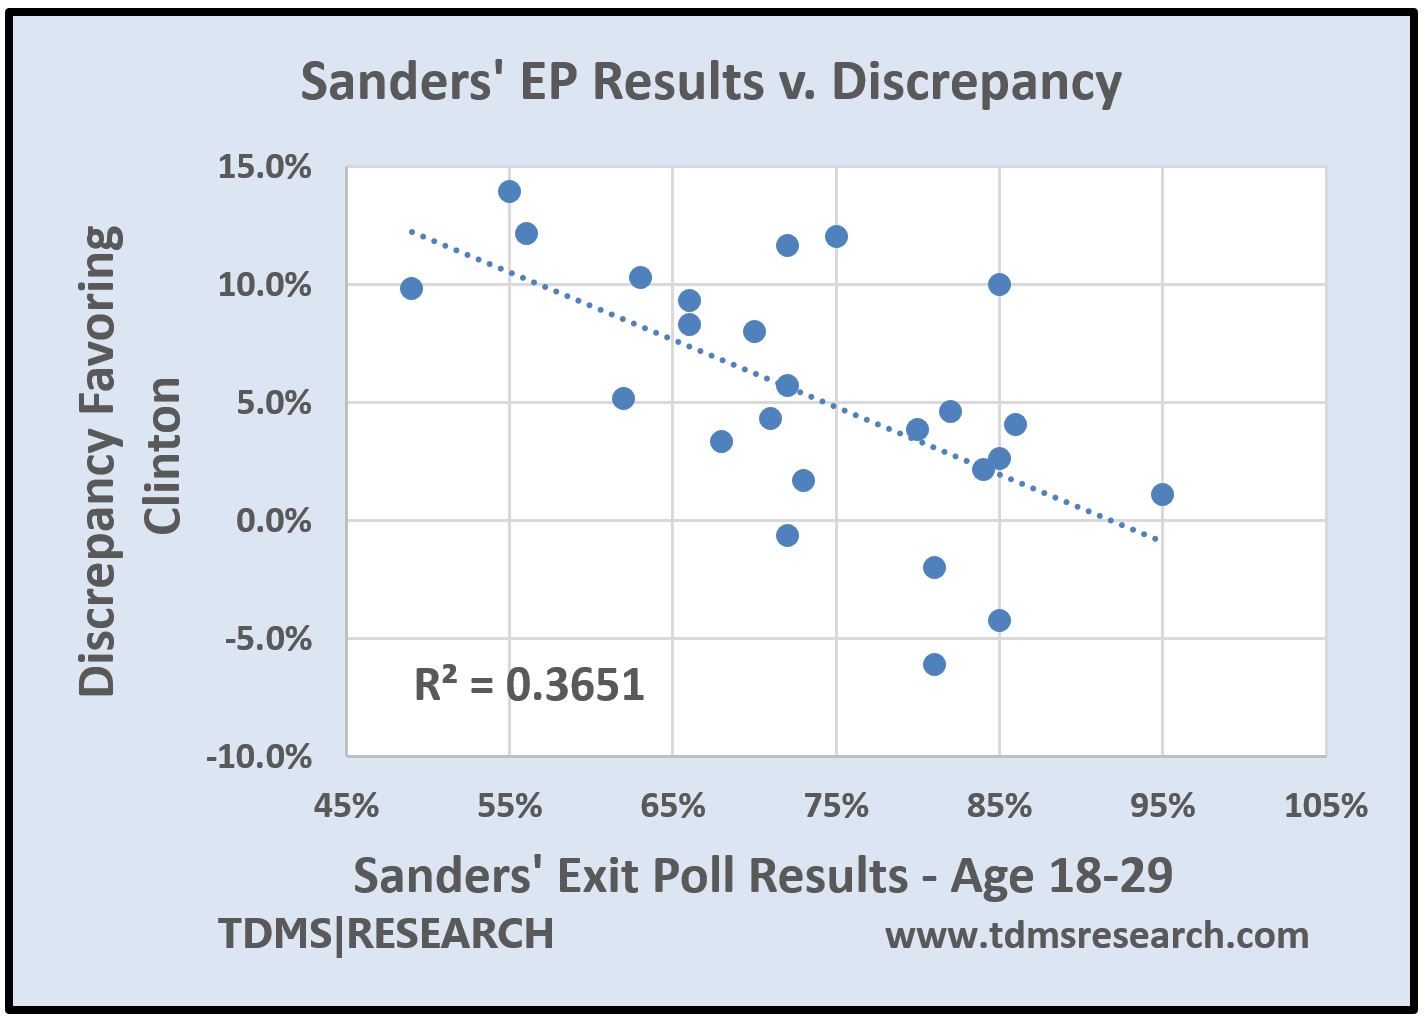 This chart shows that as the enthusiasm level increased for Mr. Sanders—as he received a greater share of the youth vote among exit poll respondents—the discrepancies between the exit polls and the computer vote counts decreased. In Alabama (represented by the topmost dot), for example, the state with the highest discrepancy at 14%, Sanders received 55% of the vote among exit poll respondents aged 18-29. Oklahoma (represented by the bottommost dot) with the lowest discrepancy at -6.1% (favoring Sanders) received 81% of the vote among exit poll respondents.
In contrast to the previous charts the trend line instead of being horizontal is pointed steeply downward indicating a negative correlation—as the youth support for Sanders increases, the discrepancies between the vote counts and the exit poll results decreases. The dots representing the various primary states are bunched closer to the trend line indicating greater correlation between the variables (R=0.60).
At R2=0.365, about a third (36.5%) of the discrepancies can be explained by Sanders’ age group results. These results are statistically significant (p-value=0.0013) with a very low probability that the relationship occurred by chance. Additional statistical details, related explanations, and data source for this and the other graphs above can be found at: https://tdmsresearch.com/2016/07/23/youthful-voters-exit-polls/.
Age is the demographic characteristic widely acknowledged as the primary determinant of candidate Sanders’ vote share—the younger the age group, the higher his vote share. This chart shows that this fact is not responsible for increasing the disparities between the exit polls and the computer vote counts. Contrary to the assertions by Mr. Cohn and others, the increasing strength of candidate Sanders youth vote is associated with decreasing the disparities. Why this is the case remains a question to be addressed later.
In summary: the analyses presented do not support Mr. Cohn’s or the standard assertions made to explain away the discrepancies between the vote counts and exit poll results. In the 2016 Democratic Party presidential primaries the proportion of youth participating in the exit polls did not drive the discrepancies. The level of enthusiasm among younger voters did not increase the exit poll participation of younger voters—it had no relationship whatsoever to the proportion of youth participation in the various primary states. And finally, the increasing level of enthusiasm among younger voters instead of increasing the discrepancies as their theory would hold, was found to significantly decrease the discrepancies between the unverified computer vote totals and the exit poll projections.
Nate Cohn, of the New York Times, and various other media pundits, have continually attempted to undermine the use of exit polls as a means to verify the results of computer vote counts that are not verified by any other means. These pundits do not hesitate to label those concerned with election integrity as “conspiracy theorists.” Along with offering little or no evidence in support of their positions, the common weakness in their commentaries is their unspoken blind faith in unverified computer vote counts. Such unquestioning faith apparently prevents them from even acknowledging the possibility that the unverified computerized vote counts may be questionable and suspect.
Download the Article :[gview file=”https://tdmsresearch.com/wp-content/uploads/2016/07/Exit-Polls-and-Computer-Vote-Counts.pdf”]
[1] Citizens for Election Integrity. State Audit Legislation Reference Guide. Last accessed on June 10, 2016. Available at: http://www.ceimn.org/state-audit-legislation-reference-guide/search?field_transparency_value_many_to_one%5B%5D=Statutes+specify+that+observers+can+verify+marks+on+the+ballots
[2] Citizens for Election Integrity. State Audit Legislation Reference Guide. Last accessed on June 10, 2016. Available at: http://www.ceimn.org/state-audit-legislation-reference-guide/search?field_transparency_value_many_to_one%5B%5D=Statutes+specify+that+observers+can+verify+marks+on+the+ballots&field_audit_contests_value_many_to_one%5B%5D=Primary+elections+audited
[3] Citizens for Election Integrity. State Audit Legislation Reference Guide. Last accessed on June 10, 2016. Available at: http://www.ceimn.org/state-audit-legislation-reference-guide/search?field_audit_contests_value_many_to_one%5B%5D=Primary+elections+audited
[4] Citizens for Election Integrity. State Audit Legislation Reference Guide. Last accessed on June 10, 2016. Available at: http://www.ceimn.org/state-audit-legislation-reference-guide/search?field_transparency_value_many_to_one%5B%5D=Statutes+require+that+audit+results+and+data+be+made+public&field_audit_contests_value_many_to_one%5B%5D=Primary+elections+audited
[5] Citizens for Election Integrity. State Audit Legislation Reference Guide. Last accessed on June 10, 2016. Available at: http://www.ceimn.org/state-audit-legislation-reference-guide/search?field_audit_discrepancies_value_many_to_one%5B%5D=Statutes+specify+use+of+a+risk-limiting+audit
[6] Citizens for Election Integrity. State Audit Legislation Reference Guide. Last accessed on June 10, 2016. Available at: http://www.electionaudits.org/bp-risklimiting
[7] USAID. Assessing and Verifying Election Results. April 2015. Available at: https://www.usaid.gov/sites/default/files/documents/1866/DI%20Assessing%20and%20Verifying%20Election%20Results%20Summary%20Document%20-%20FINAL%20PDF%20(without%20bleeds)%20(5-19-15).pdf. Last Accessed on June 12, 2016.
[8] See annotated table and associated article: de Macedo Soares, T. The Suspect Massachusetts 2016 Primary. TDMS|Research. June 14, 2016. Available at: https://tdmsresearch.com/2016/06/14/the-suspect-massachusetts-2016-primary/
[9] Email correspondence between Theodore de Macedo Soares (the author of this exit poll section) and Mr. Joseph Lenski, Executive Vice President Of Edison Research, on July 19, 2016
[10] Email correspondence between Theodore de Macedo Soares and Mr. Joseph Lenski, Executive Vice President of Edison Research on July 12 and July 13, 2016
[11] RCP average of pre-election polls. See, for example, the next note below
[12] http://www.realclearpolitics.com/epolls/2016/president/mi/michigan_democratic_presidential_primary-5224.html
[13] http://www.realclearpolitics.com/epolls/2016/president/oh/ohio_democratic_presidential_primary-5313.html
[14] Email correspondence between Theodore de Macedo Soares and Mr. Joseph Lenski, Executive Vice President of Edison Research on July 13, 2016
[15] http://www.realclearpolitics.com/epolls/2016/president/tx/texas_democratic_presidential_primary-4158.html#polls
[16] Groves, R. (1989). Survey errors and survey costs. New York. Wiley.
[17] de Macedo Soares, T. Republican Party Detailed tables. TSE of the 2016 Primaries. TDMS|Research. Available at: https://tdmsresearch.com/2016/07/13/republican-party-detailed-tables-tse-2016-primaries/
[18] Cohn, N. Exit polls and why the primary was not stolen from Bernie Sanders. New York Times. June 27, 2016. Available at: http://www.nytimes.com/2016/06/28/upshot/exit-polls-and-why-the-primary-was-not-stolen-from-bernie-sanders.html?_r=1
[19] Robert F. Kennedy Jr. Was the 2004 Election Stolen? June 01, 2006. Available at: http://www.commondreams.org/views06/0601-34.htm. Last accessed on June 12, 2016.
[20] Bump P. How exit polls work, explained. The Washington Post. April 22, 2016. Available at: https://www.washingtonpost.com/news/the-fix/wp/2016/04/22/how-exit-polls-work-explained/. Last accessed on June 13, 2016.
[21] Hatlem, D.J. Hillary Clinton vs Bernie Sanders: In-depth Report on Exit Polling and Election Fraud Allegations. Counterpunch. May 11, 2016. Available at: http://www.counterpunch.org/2016/05/11/hillary-clinton-versus-bernie-sanders-in-depth-report-on-exit-polling-and-election-fraud-allegations/
[…] ← Previous Next → […]
Thank you for this series of posts. Ever since the exit polls predicted a Kerry win in Ohio in 2004, a result which did not correspond to the count, Edison has been trying to explain how their errors are always in favor of the Republicans. Where Republicans are predicted to lose, they win. Where they are predicted to win, they win. In other words, no matter what, Republicans win.
In 2004, the “shy Republican”/”Bradley effect” hypothesis was pushed to explain what was going on. It was unbelievable then, and unbelievable now. At a minimum, it is absolutely amazing that anyone pays Edison for results that are consistently “wrong.”
Edison on 2004: abcnews.go.com/images/Politics/EvaluationofEdisonMitofskyElectionSystem.pdf
Charles, what makes you so sure that the exit polls are wrong and the computer vote counts correct?
Theodore, I have no opinion on whether the vote counts or the exit polls are right or wrong. I don’t trust the vote counts because so many are unverified; we know the weaknesses of the machines. But until someone confesses they have been fiddling the machines, allegations of fraud will remain in the realm of speculation.
But neither do I trust the exit polls. True, the US government has claimed fraud in foreign elections based on deviations between the exit polls and the results, but the US government used these allegations to destabilize governments it didn’t like. One doesn’t imagine the CIA is constrained by veracity or consistency as it pursues such goals.
What I am saying is that Edison gets paid quite a lot of money for producing results that we are then told aren’t right because they don’t agree with the vote count. *That* doesn’t compute at all.
Yep I have been watching the crap for years also. Also been watching Richard Charnin back when he was Truthisall. I hope we can do something this time.
Mr Soares, why would the voting machines be so strongly for Clinton in the Primaries, and so against her in the General. Are you saying whoever had control over the machines during the Primary wanted Clinton to win then but lose the General? Doesn’t make sense.
Well, if someone wanted Trump to win, they might boost the candidate that polled weaker against him (Clinton) and then boost his votes in the general election. Makes a lot of sense to me.
Anne, please notice that the articles and tables published in this website do not speculate about who did what and why. We prefer to stick to the data and facts. The exit polls indicate that our votes are not being accurately counted. Our computerized vote counts are not observable and are unverified by human conducted counts.
To protect the integrity of their elections, in 2009 the Federal Court of Germany (their version of the US Supreme Court) ruled that every aspect of an election must be publicly observable and effectively banned the use of computers to count their ballots. The Court also noted that “programming errors in the software or deliberate electoral fraud committed by manipulating the software of electronic voting machines can be recognized only with difficulty.” In Germany there is no longer any concern about possible computerized election fraud as now every ballot is hand-counted in public.
Countries such as Canada, France, Ireland, Italy, Denmark, Finland and 53 other countries protect the integrity of their elections with hand-counted paper ballots. See The Suspect Massachusetts 2016 Primary article
why would trump have donated to the clinton foundation if they weren’t in cahoots? why would have obama been against the recount? why did obama and clinton forward john mccain’s policies when they had political power? the whole goal was to sabotage sanders. the elites win with either a trump or clinton victory. if you look at the exit polls from the general, they imply votes were stolen from third parties and the election was rigged for trump… and most of the dem reps trashed the hand recount and didnt complain… reminds me of florida 2000
i think the elites knew a clinton presidency would be tougher for them. she would have faced opposition from the left and right (voters) whereas trump only really receives criticism from the left. i had also heard the assange was going to release incriminating info on clinton if she had one. i wish he had known she and trump were in cahoots and publically supported jill stein
that* won*
HI Theodore, Do we know how many white people voted? I can only find percentages and the total number of votes and could calc a percent but I would like a real number. Thanks for what you are doing