By Theodore de Macedo Soares.
This article is part of the exit poll section included in the report . by Election Justice USA. Statistical details will soon be included.
Nate Cohn, a writer for the New York Times, recently wrote an article theorizing that the reason “why…exit polls so tilted toward Mr. Sanders,” was due to the fact that “young voters are far likelier to complete the exit polls than older voters.” Although he acknowledged that Edison Research corrects for this usual and well known fact, Mr. Cohn asserts that their correction “falls short.”[1]
Mr. Cohn’s assertion is a variation of the popular criticism of exit polls that centers on nonresponse error as the cause for the discrepancies between the exit polls and the final vote count—the voters of a particular candidate may be overrepresented because they are more enthusiastic for their candidate and thus more willing to fill out the exit poll’s anonymous questionnaires than the voters for another candidate. This criticism is generally put forth without any evidence and has been refuted as the explanation for the discrepancies in previous elections. [2] Additionally, Edison Research works very hard to reduce such errors by taking note of the characteristics of the nonresponders, such as their gender and age range, and adjust their exit polls results accordingly. [3]
According to Mr. Cohn, the discrepancies between the exit polls and the computer vote counts that in 21 of 25 states favored Clinton were caused by an overrepresentation of younger voters in the exit polls. As younger voters overwhelmingly voted for Sanders, the theory goes, the alleged uncorrected higher proportion of younger voters participating in the exit polls distorted the exit polls in Sanders’ direction.
Actual 2016 Democratic Party primaries data does not support Cohn’s theory:
(1) The proportion of youthful voters in these primaries had no correlation with the discrepancies between the exit polls and the unverified computer vote counts that favored candidate Clinton.
(2) The enthusiasm of youthful voters for candidate Sanders had no correlation with the proportion of youthful voters in the different states.
(3) Higher proportions of youthful exit poll respondents voting for Sanders, instead of correlating with higher discrepancies, actually correlates with lower discrepancies; the opposite of what would hold according to Cohn’s asserted explanation for the discrepancies.
Doug Johnson Hatlem, in an article published in CounterPunch, pushed back on this theory by noting that states such as Alabama, Georgia, Ohio, and South Carolina with lower proportions of young voters, had high discrepancies between the exit polls and vote counts favoring Clinton while states such as North Carolina, with higher proportions of young voters, had small discrepancies.[4] Here, in the following first graph, the observations of Mr. Hatlem are extended to include the Democratic Party primaries of all states for which exit polls were conducted.
(1) If Mr. Cohn is correct then one should see a clear correlation between the proportion of youthful voters and the discrepancies—the greater the proportion of younger voters in the exit poll, the greater the discrepancy. Actual data, however, shows that there is near zero correlation between the proportion of exit poll responders age 18-29 and the discrepancies found in the 25 primary states for which exit polls were conducted:
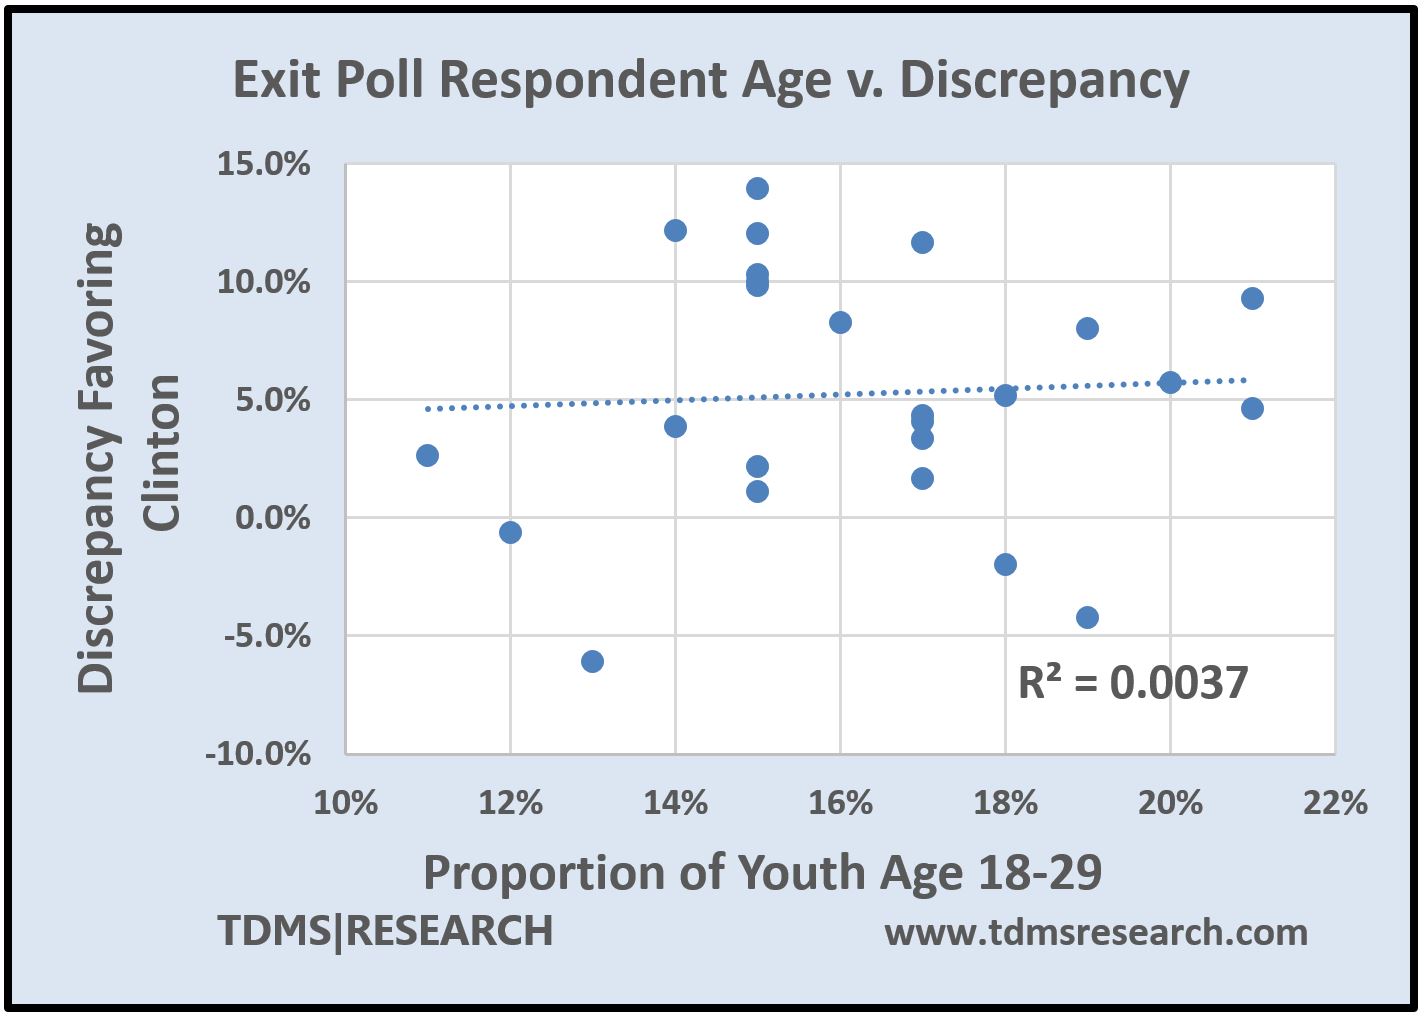 Each dot on the graph represents exit poll data for a state in the 2016 Democratic Party primaries. The leftmost dot, for example, represents the results of the primary election in Pennsylvania. The dot marks the proportion of voters age 18-29 at 11% on the horizontal x-axis and the discrepancy between the exit poll and the computer vote count at 2.6% on the vertical y-axis. The first thing to notice is that the linear trend (the dotted line) is almost horizontal indicating no relationship between the increasing proportion of youth and the increasing discrepancies in the various states. The second thing to notice is that the dots are widely scattered around the trend line. If there were a strong positive correlation, the dots would be bunched close to the trend line and it would be pointing steeply upwards; showing that greater proportions of youthful voters resulted greater discrepancies in favor of Clinton.
This chart shows that as the proportion of voters aged 18-29 increases in 25 primary states, there is almost no increase in the discrepancies between the exit polls and the unverified computer vote counts. As the results for every state are spread-out in the graph there is also a near zero (R =0.061) correlation between the proportions of this age group in the various states and the discrepancies. The proportion of the discrepancies that can be explained by the proportion youthful voters is also almost zero at 0.37% (R2=0.0037). Contrary to Mr. Cohn’s theory, the proportion of youthful voters represented in the exit polls is not correlated with the exit polling discrepancies and does not explain why Democratic candidate Sanders’ computer vote counts were so much less than predicted by the exit polls in so many states.
Increasing the age range to 18-44 also does not support Mr. Cohn’s assertions: there is a near zero (R=0.074) correlation between the discrepancies of the exit polls with the unverified computer vote counts. The proportion of the discrepancies that can be explained by the proportion of youthful voters is also almost zero at 0.55% (R2 =0.0055; graph not shown).
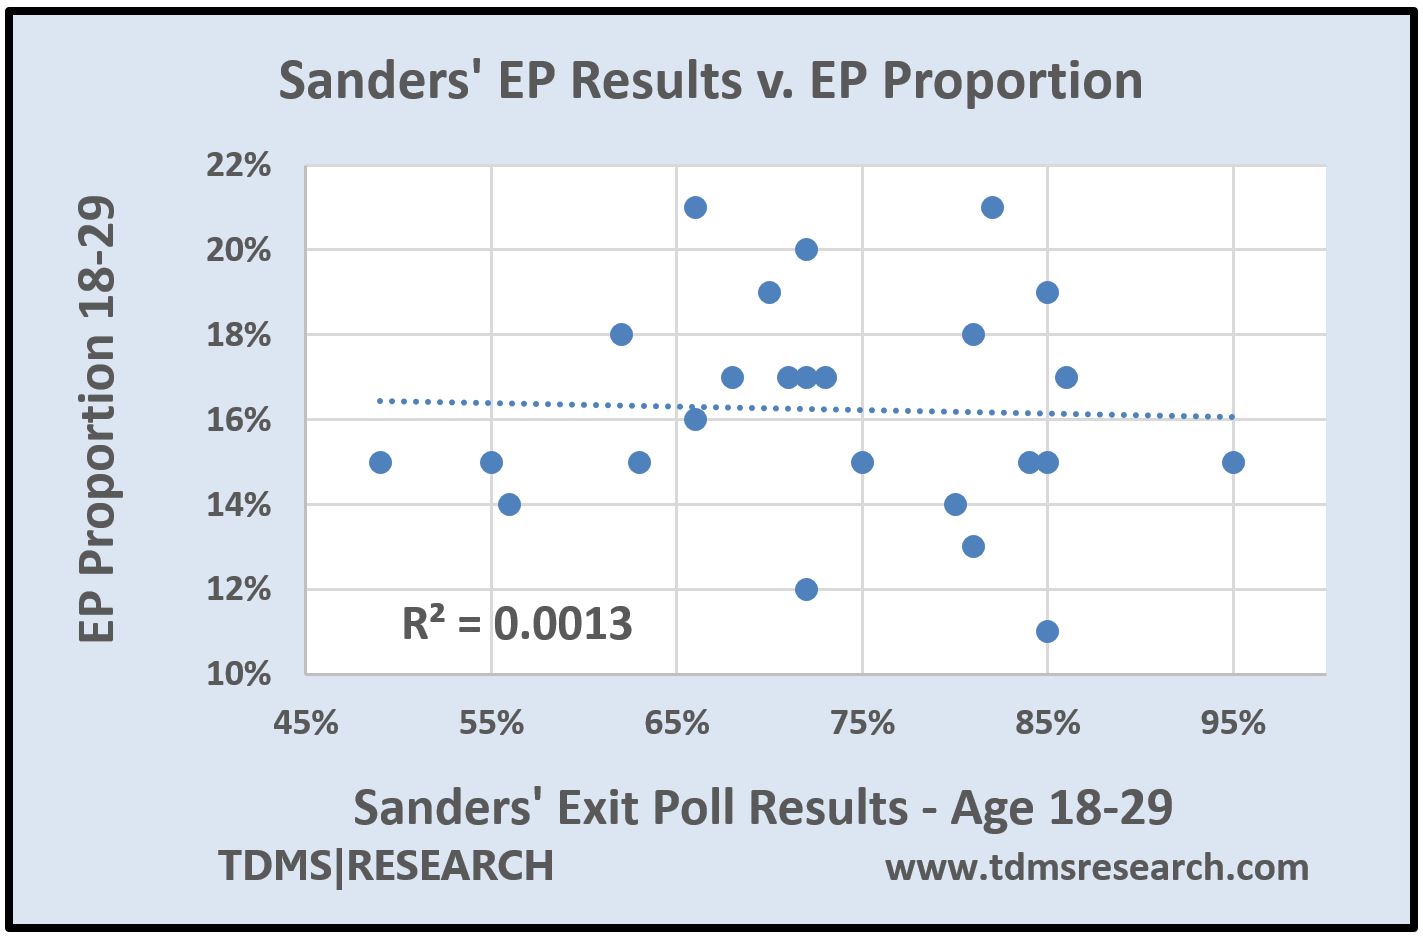 (2) If Mr. Cohn is correct the higher level of youthful enthusiasm for Mr. Sanders should result in larger proportions of youthful voters participating in the exit polls in the different states. Actual data, however, shows that there is near zero correlation between the enthusiasm of youthful voters and their proportion in the exit polls for all states.
This chart shows that as the enthusiasm level increased for Mr. Sanders—as his share of the youth vote increased among exit poll respondents—there was no accompanying increase in the proportion of youthful exit poll respondents. In Mississippi (represented by the leftmost dot), for example, Sanders received 49% of the exit poll vote of the respondents age 18-29 while the proportion of this age group participating in the exit poll was estimated at 15% by Edison Research. In contrast, Vermont (represented by the rightmost dot) with the same proportion of youthful voters (15%) had 95% of this age group stating they voted for Sanders. Similar to the chart above, the almost horizontal trend line shows no correlation between the increasing exit poll vote share for Sanders and the increasing proportions of youthful voters.
Increasing the age range to 18-44 also does not support Mr. Cohn’s assertions: there is a near zero (R2 =0.0042) relationship between the level of enthusiasm for this extended age group and their proportions in the exit polls of various states (graph not shown).
Contrary to Mr. Cohn’s theory, the level of enthusiasm for Mr. Sanders was not at all correlated with any increase in the proportion of youthful voters in the exit polls.
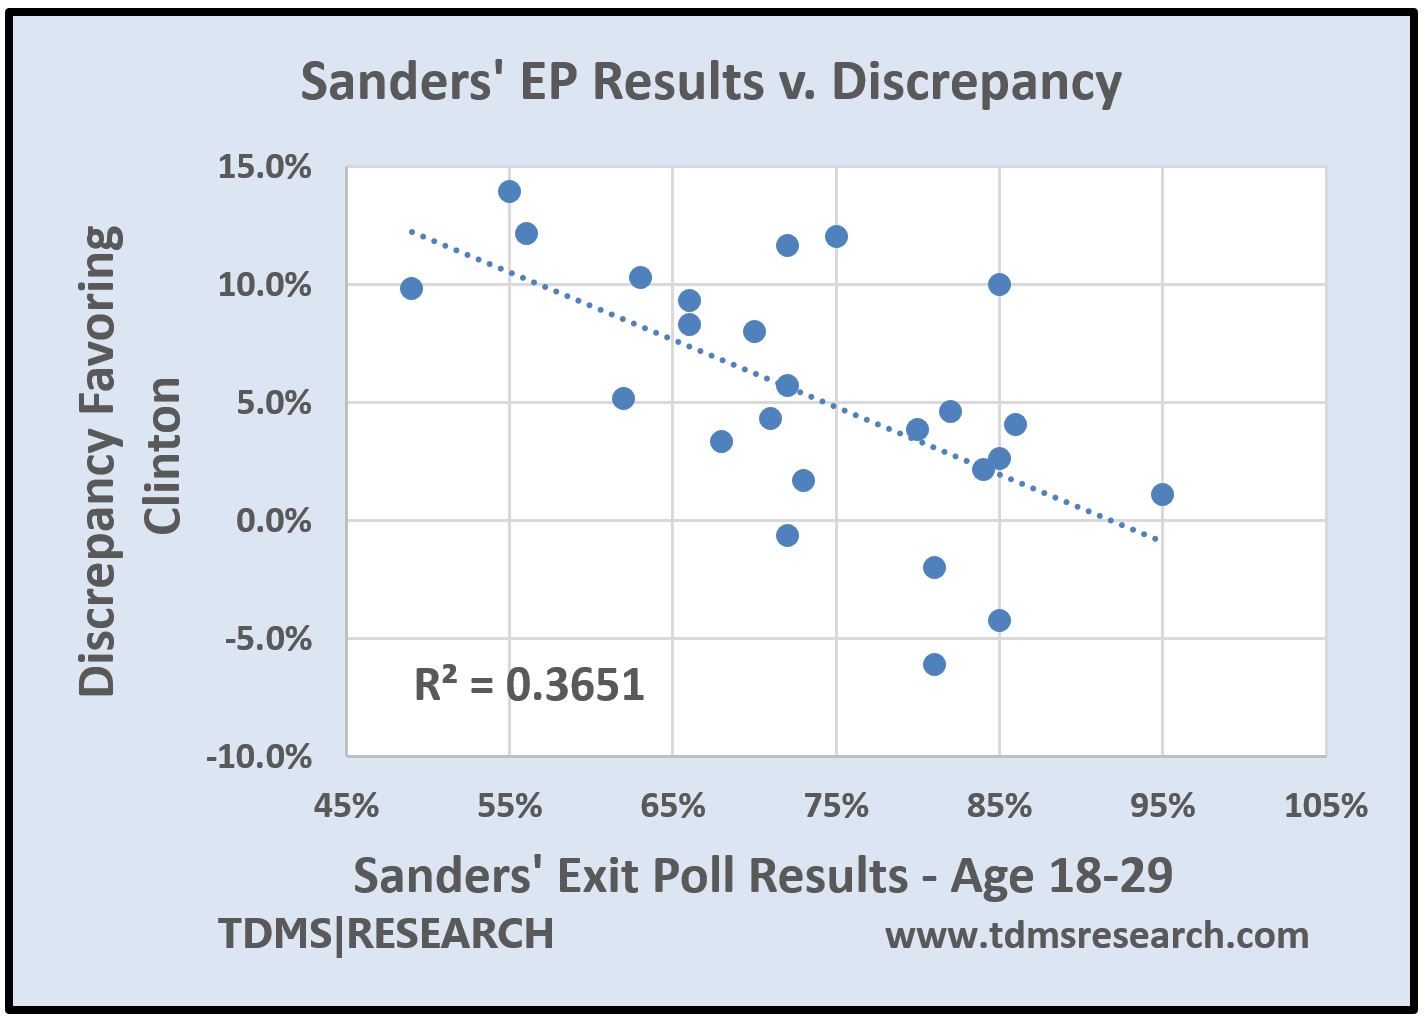 (3) Finally, If Mr. Cohn’s and the standard explanation for vote count/exit poll discrepancies is correct, higher levels of youthful enthusiasm for candidate Sanders should result in them being more willing to fill out the exit poll questionnaires and thus increase the discrepancies between the exit poll predictions and the unverified computer vote counts. Actual data, however, shows just the opposite: as Senator Sanders share of the youth vote among exit poll respondents increased, the discrepancies decreased.
This chart shows that as the enthusiasm level increased for Mr. Sanders—as he received a greater share of the youth vote among exit poll respondents—the discrepancies between the exit polls and the computer vote counts decreased. In Alabama (represented by the topmost dot), for example, the state with the highest discrepancy at 14%, Sanders received 55% of the vote among exit poll respondents aged 18-29. Oklahoma (represented by the bottommost dot) with the lowest discrepancy at -6.1% (favoring Sanders) received 81% of the vote among exit poll respondents.
In contrast to the previous charts the trend line instead of being horizontal is pointed steeply downward indicating a negative correlation—as the youth support for Sanders increases, the discrepancies between the vote counts and the exit poll results decreases. The dots representing the various primary states are bunched closer to the trend line indicating greater correlation between the variables (R=0.60).
At R2=0.365, about a third (36.5%) of the discrepancies can be explained by Sanders’ age group results. These results are statistically significant (p-value=0.0013) with a very low probability that the relationship occurred by chance. Additional statistical details, related explanations, and data source for this and the other graphs above can be found at: https://tdmsresearch.com/2016/07/23/youthful-voters-exit-polls/.
Age is the demographic characteristic widely acknowledged as the primary determinant of candidate Sanders’ vote share—the younger the age group, the higher his vote share. This chart shows that this fact is not responsible for increasing the disparities between the exit polls and the computer vote counts. Contrary to the assertions by Mr. Cohn and others, the increasing strength of candidate Sanders youth vote is associated with decreasing the disparities. Why this is the case remains a question to be addressed later.
In summary: the analyses presented do not support Mr. Cohn’s or the standard assertions made to explain away the discrepancies between the vote counts and exit poll results. In the 2016 Democratic Party presidential primaries the proportion of youth participating in the exit polls did not drive the discrepancies. The level of enthusiasm among younger voters did not increase the exit poll participation of younger voters—it had no relationship whatsoever to the proportion of youth participation in the various primary states. And finally, the increasing level of enthusiasm among younger voters instead of increasing the discrepancies as their theory would hold, was found to significantly decrease the discrepancies between the unverified computer vote totals and the exit poll projections.
Nate Cohn, of the New York Times, and various other media pundits, have continually attempted to undermine the use of exit polls as a means to verify the results of computer vote counts that are not verified by any other means. These pundits do not hesitate to label those concerned with election integrity as “conspiracy theorists.” Along with offering little or no evidence in support of their positions, the common weakness in their commentaries is their unspoken blind faith in unverified computer vote counts. Such unquestioning faith apparently prevents them from even acknowledging the possibility that the unverified computerized vote counts may be questionable and suspect.
It is to the very strong statistical evidence for this notion—that electronic vote counts may have been tampered with in the 2016 Democratic presidential primaries—that we turn in the next section of the report.
[1] Cohn, N. Exit polls and why the primary was not stolen from Bernie Sanders. New York Times. June 27, 2016. Available at: http://www.nytimes.com/2016/06/28/upshot/exit-polls-and-why-the-primary-was-not-stolen-from-bernie-sanders.html?_r=1
[2] Robert F. Kennedy Jr. Was the 2004 Election Stolen? June 01, 2006. Available at: http://www.commondreams.org/views06/0601-34.htm. Last accessed on June 12, 2016.
[3] Bump P. How exit polls work, explained. The Washington Post. April 22, 2016. Available at: https://www.washingtonpost.com/news/the-fix/wp/2016/04/22/how-exit-polls-work-explained/. Last accessed on June 13, 2016.
[4] Hatlem, D.J. Hillary Clinton vs Bernie Sanders: In-depth Report on Exit Polling and Election Fraud Allegations. Counterpunch. May 11, 2016. Available at: http://www.counterpunch.org/2016/05/11/hillary-clinton-versus-bernie-sanders-in-depth-report-on-exit-polling-and-election-fraud-allegations/
This is a very interesting discussion and my observation from a neutral position is that if I were involved in an election fraud to favour Trump, I would do the following:
1. I would wish to influence the vote count for the Democratic Party nominee to favour the candidate that was least popular and carrying a lot of baggage, ie, Clinton.
2. I would encourage freedom for the chosen (by manipulation, if necessary) Republican candidate, Trump, to be as controversial and populist as possible, to allow for the discrepancy that would occur in exit polls by reasoning that people were too embarrassed to admit to voting for Trump because of his adverse publicity.
3. I would want the Republican candidate to tear into his opponent and close the margin of swing – and, if necessary, hope to invoke the re-opening of a case of corruption through the Republican influence within the FBI if behind in the polls. This way, the fraud would be less suspect and could be argued to be within the margin of error.
4. Full tactics of voter suppression would be implemented in all areas of Republican control to ensure a Republican victory. The unusual discrepancies at the exit polls would appear the norm over time – yep, it’s happened before – in the swing state locations.
What I would fear, if I were involved, would be those who compare the accuracy of exit polls in other places, such as the UK (where only hand count is allowed). The probability of voting fraud would seem quite high to outside independent observers and experts in the field.
In opposition, I would hope to lobby the current President to open an independent inquiry with powers to recommend nationwide changes to the system of counting and monitoring elections, before his term of office expires.
I wish you well.
However, I should add that, as speculations can be way off and easily countered, what is needed to allay suspicion is a full independent inquiry. President Obama can set this in motion before he leaves office. We need the facts.