by Theodore de Macedo Soares.
Democratic Party 2016 primaries. This table, Democratic Party Table 2, shows the discrepancies between exit poll results and the unverified computer vote counts. The margin of error applied represents the total survey error (TSE) calculated for the 2016 primaries. Discrepancies that exceed the total survey error of the exit polls are shown in the last column. Compared to Table 1, applying TSE instead of the standard MOE results in decreasing the discrepancies by which the states exceed error calculations. Additionally, the discrepancy in Indiana, exceeding the MOE in Table 1, does not, in this table, exceed the TSE applied.
Surveys of all kinds measure a small sample of the population at interest. Survey related errors can accumulate in all phases of a survey: Coverage error (not able to sample selection of the population), nonresponse error (not able to poll all persons in the chosen sample), sampling error (when the survey sample differs from the population being measured), and measurement error (from inaccurate responses).* When the true values of the population are known, the total survey error can be easily calculated.
The approach taken in the following tables takes into account all the possible sources of error inherent in exit polls. It does this by comparing 106 exit poll results for the main candidates in the Republican Party primaries (Carson, Bush, Kasich, Rubio, Cruz, and Trump) with their actual vote totals. In this way the actual total survey error (TSE) can be measured. With the exception of the primaries in two states, West Virginia and Texas, with very large discrepancies (18% and 10.6% respectively) going against Trump, the exit polls for Republican Party primaries have been fairly accurate.
By increasing the standard statistical margin of error (MOE) by 32%, and excluding the outliers in West Virginia and Texas, the percentage of exit polls exceeding this increased MOE goes down to 4.76% which is just under the expected 5% in an exit poll with a confidence interval of 95%. The tables below take into account the total survey error by increasing the MOE by 32%.
Coincidentally, the total survey error calculated for the 2016 primaries that increases the standard MOE by 32% is very close to the 30% increased MOE applied by other analysts to these and other exit polls. The significant difference is that whereas their applied margin of error only addresses the statistical sampling error associated with the size and configuration of the sample, the almost identical TSE applied here takes into account all the possible sources of error common in surveys such as the exit polls being examined.
Applying the TSE calculated from the Republican Party primaries to the Democratic Party primaries is supported by the fact that for the exception of South Carolina, that held Democratic and Republican Party primaries on different days, the exit polls for both parties were conducted: on the same day, in the same precincts, with the same interviewers, and with the same methodologies.
*Groves, R. (1989). Survey errors and survey costs. New York. Wiley.
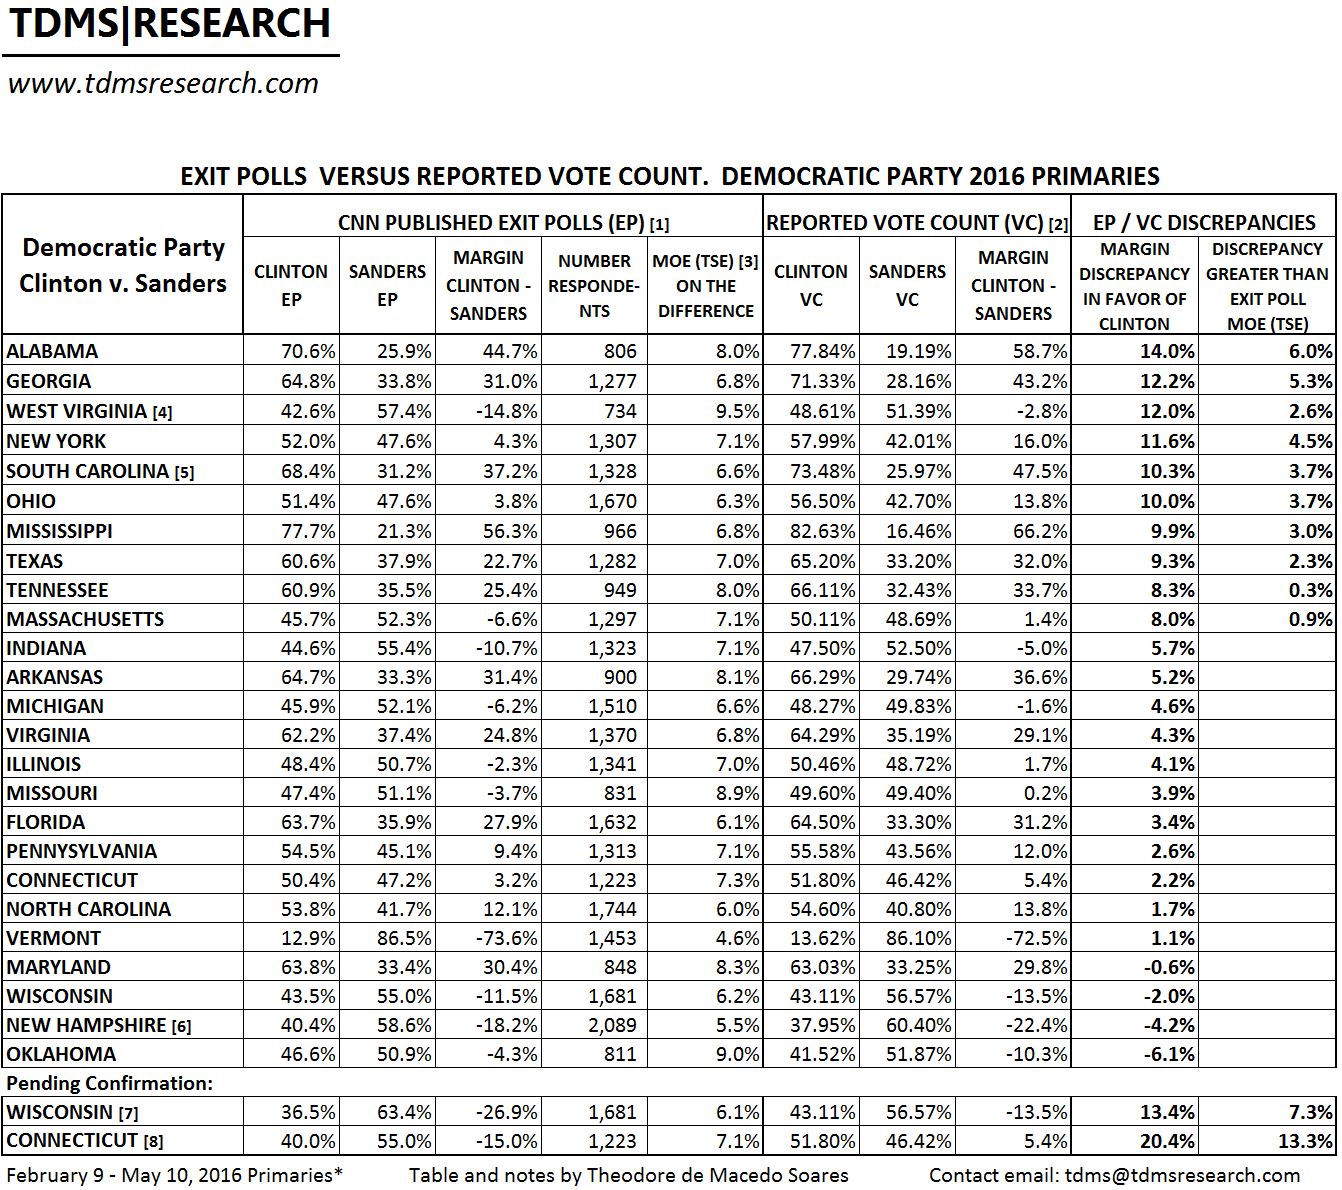
[1] Exit polls (EP) conducted by Edison Research and published by CNN shortly after the closing of polls for the state and downloaded by TdMS. Copies are available. Exit poll results are derived from the gender category–the proportion of men and women voting for each candidate. As these first published exit polls were altered/adjusted to conform to the unverified computer vote counts, the discrepancies above are adjusted to near zero in the final EPs.
[2] New York Times reported 100% vote count (99% for NY, CT, MD, PA Primaries 6/12/2016). http://www.nytimes.com/elections/results
[3] The margin of error calculated in this column represents the total survey error (TSE) derived by comparing 106 exit poll results for the various candidates in the 2016 Republican Party primaries to their vote count. As the completed exit polls are compared to the vote totals the TSE measures all errors associated with an exit poll–sampling, coverage, nonresponse, measurement, and post-survey errors–and not just the sampling error associated with the standard margin of error. Calculations by TdMS. The found TSE results in increasing the standard margin of error (MOE) by 32%. MOE calculated according to Franklin, C. The ‘Margin of Error’ for Differences in Polls. University of Wisconsin, Madison, Wisconsin. October 2002, revised February 2007. Available at: https://abcnews.go.com/images/PollingUnit/MOEFranklin.pdf. A 30% increase in the MOE for an exit poll has also been suggested by Merkle, D.M. and M. Edelman. 2000. A review of the 1996 voter news service exit polls from a total survey error perspective. In (P.J. Lavrakas and M. Traugott, eds.). Election polls, the news media, and democracy. Chatham House, New York.
[4] The Democratic Part primary in West Virginia was unique in that a large part of the discrepancy disfavoring Sanders occurred by an 8.3% increase in the vote totals for minor candidates than predicted by the exit polls. To show this discrepancy in this table, for this state only, the exit poll totals and vote totals for the other candidates were added to Clinton’s columns and the resulting discrepancy shown is between Sanders and Clinton combined with others.
[5] Exit poll published by NBCnews.com at 7:02 PM on February 27, 2016. Downloaded by Jonathan Simon of Election Defense Alliance. EP number of respondents estimated by subtracting 133 respondents (average addition of respondents in all final adjusted Democratic Party state EPs with greater than 1,000 respondents) from 1,461 respondents in the final adjusted EP for SC.
[6] Exit poll results for NH derived from NYTimes Graphics Twitter publication on 6:30 PM, February 9, 2016. Accessed May 20, 2016. Available at: https://twitter.com/nytgraphics/status/697246344038256642. EP number of respondents estimated by subtracting 133 respondents (average addition of respondents in all final adjusted Democratic Party state EPs with greater than 1,000 respondents) from 2,222 respondents in the final adjusted EP for NH.
[7] Here, Wisconsin exit polls results are derived from a NBC News broadcast, on April 5, 2016 at 4:24 PM, of white vote percentages for Clinton (32%) and Sanders (68%) in early exit poll results (source: https://richardcharnin.wordpress.com/2016/04/06/a-preliminary-probability-analysis-of-the-wisconsin-primary/). The exit poll first published by CNN had white vote percentages for Clinton and Sanders at 40% and 58% respectively. All other news broadcasts, that I have documented, of early exit poll releases of demographic characteristics of voters in other primary states closely matched CNN’s first published exit polls. As Edison Research alters their exit polls to match the incoming vote counts, they may have done so here (and perhaps other states) and altered their early exit poll data to match vote totals acquired from exit poll precinct locations and or AP prior to the closing of polls in the state. Only the release of Edison’s actual exit poll data will be able to reveal the true discrepancies between their unaltered exit polls and the final unverified computer vote counts in this and other states.
[8] Here, Connecticut exit poll results come from the screenshot of a preliminary exit poll result, apparently broadcast by ABC News, showing Sanders with 55% of the vote and Clinton with 40% (source: https://richardcharnin.wordpress.com/2016/06/13/the-connecticut-primary-did-clinton-really-win/). The time of publication is not stated. If this screenshot is legitimate, ABC News, depending on the time of the broadcast, may have, perhaps unintentionally, revealed exit poll race results before the closing of polls in contradiction of the news networks’ stated policies. Again, the release of Edison’s actual detailed exit poll data would allow a determination of the true discrepancies between unaltered exit polls and the vote count.
* According to personal communication on May 23, 2016 from Mr. Lenski, Executive Vice President of Edison Research, as the National Election Pool (NEP) consisting of ABC, CBS, FOX, NBC, and the Associated Press did not provide funding to conduct exit polls for the remaining primaries, they did not occur. The remaining primaries for which no exit polls were conducted:
May 24 – Republican Party primary: Washington. June 5 – Democratic Party primary: Puerto Rico
June 7 – Democratic and Republican Party primaries: California, New Jersey, New Mexico, South Dakota, and Montana
June 14 – Democratic Party primary: District of Columbia
REVISIONS:
July 13, 2016. Updated to included introductory section to this table and to the methods applied in error calculations.
July 17, 2016. Minor edits to the table and text.
July 1, 2016. Corrected the number of states with Democratic and Republican party primaries on different days for which exit polls were conducted, from three states to one (South Carolina).
[…] ← Previous Next → […]
[…] Matrix of Deceit: Forcing Pre-election and Exit Polls to Match Fraudulent Vote Counts Proving Election Fraud: Phantom Voters, Uncounted Votes and the National Poll LINKS TO POSTS Democratic Primaries spread sheet Democratic party table: 2016 primaries […]
[…] Matrix of Deceit: Forcing Pre-election and Exit Polls to Match Fraudulent Vote Counts Proving Election Fraud: Phantom Voters, Uncounted Votes and the National Poll LINKS TO POSTS Democratic Primaries spread sheet From TDMS Research: Democratic 2016 primaries […]
Maybe this is already being done or already considered and dismissed as not feasible but and I am simply unaware of it so forgive me if this is a stupid question or if you’ve already answered it 500 times or whatever the case may be, but I still have to ask… couldn’t Edison Research be sued for a court ordered release of the initial exit poll data in all the states that they did conduct such a poll?
Susannah, the short answer is yes. Probably only a court order would be able to force the release of their raw exit poll data with an accounting of all the adjustments that were made to the data.
Attention to important details; however, is necessary. A suit asking for the release of their data must also take into consideration that the National Election Pool (NEP); consisting of ABC, CBS, FOX, NBC, and the Associated Press contracted Edison to perform the exit polls. NEP may, consequently, own the data or they may have shared ownership of the data. Probably need to sue both entities.
Suing in a state court perhaps may only lead to the release (if the suit is successful) of exit poll data pertaining to that state. Suing in federal court may lead to access to the data pertaining to all states. The attorneys seeking the data on behalf of the plaintiffs must do their homework to have a chance of success.
[…] Matrix of Deceit: Forcing Pre-election and Exit Polls to Match Fraudulent Vote Counts Proving Election Fraud: Phantom Voters, Uncounted Votes and the National Poll LINKS TO POSTS Democratic Primaries spread sheet From TDMS Research: Democratic 2016 primaries […]
[…] Voters, Uncounted Votes and the National Poll LINKS TO POSTS Democratic Primaries spread sheet From TDMS Research: Democratic 2016 primaries In California there is just ONE county which uses an Open Source Voting System. Could that be why […]
[…] Matrix of Deceit: Forcing Pre-election and Exit Polls to Match Fraudulent Vote Counts Proving Election Fraud: Phantom Voters, Uncounted Votes and the National Poll LINKS TO POSTS Democratic Primaries spread sheet From TDMS Research: Democratic 2016 primaries […]
[…] Matrix of Deceit: Forcing Pre-election and Exit Polls to Match Fraudulent Vote Counts Proving Election Fraud: Phantom Voters, Uncounted Votes and the National Poll LINKS TO POSTS Democratic Primaries spread sheet From TDMS Research: Democratic 2016 primaries […]
Hi, do you have copies of CNN’s unadjusted exit polls that I can download? I was looking to analyze them, but I wanted breakdowns by age.
I wwas very pleased to find this website. I wanted to thank you for your time due to ths wonderful read!!
I definitely appreciated every bitt of it andd I have you book maried to see new information in your blog.
Hello everyone, it’s my first go to see at this web page,
and piece off writing is in fact fruitful in favor of me, keeep up posting these
types of articles.
Thanks. New posts next week.
Thanks for this post, I am a big big fan of this internet site would like too go along
updated.
Thanks
I am impressed with this internet site, very
I am a big fan.
Thanks. I’m glad you like it!
Thanks for your efforts Theodore. Can you please explain you chart, specifically this data point:
CNN – Alabama exit polls
As of Aug. 2nd 2016, on their exit poll website:
Men (40% of the people surveyed) 73% for Clinton
Women (60% of the people surveyed) 80% for Clinton
You chart for Alabama shows
Clinton – 70.6%
So did CNN change the data at some point, or can you show exactly how you achieved 70.6%? If everyone is using Edison’s data, why the big difference? If it is altered somehow, how could it go down to 70.6% when both men and women are at 73% at the very least?
When you say “Published on CNN” well I just checked a few states and they are not equal to your chart EP that comes from CNN. I would expect the few people like me who go look for the numbers themselves would like to see an explanation for the 70.6% et. al.
The exit poll published by CNN soon after polls closed in Alabama (polls closed at 8:00pm, I downloaded the exit poll at 8:09 pm) had men/women proportions of 42% and 58% respectively. Clinton received 66% and 74%, Sanders, 30% and 23% of men and women respectively.
As Edison Research, the polling firm that conducts exit polls for the major networks, assumes the computer vote count is correct, they alter their exit polls to conform to the unverified computer vote totals.
As the section “Discrepancies between Computer Counts and Exit Polls Likely Larger” in https://tdmsresearch.com/2016/07/26/exit-polls-and-computer-vote-counts/, discusses, even these first published exit polls likely underestimated Sanders’ results.
Thanks for the reply. It makes no sense to me why Edison would change anything after a poll closed. Just to make themselves look better? I understand the purpose of the exit poll is just to give the media outlets an idea of what is going on, but afterwards, why change anything unless there are errors? Really weird.
[…] Voters, Uncounted Votes and the National Poll LINKS TO POSTS Democratic Primaries spread sheet From TDMS Research: Democratic 2016 primaries This analysis is based on the official adjusted exit poll vote shares. The model calculates […]
I need to to many thanks for this fantastic read!!
I definitely enjoyed every little it. I have got got you book marked to check out new stuff you post
[…] Matrix of Deceit: Forcing Pre-election and Exit Polls to Match Fraudulent Vote Counts Proving Election Fraud: Phantom Voters, Uncounted Votes and the National Poll LINKS TO POSTS Democratic Primaries spread sheet From TDMS Research: Democratic 2016 primaries […]
[…] Matrix of Deceit: Forcing Pre-election and Exit Polls to Match Fraudulent Vote Counts Proving Election Fraud: Phantom Voters, Uncounted Votes and the National Poll LINKS TO POSTS Democratic Primaries spread sheet From TDMS Research: Democratic 2016 primaries […]
I simply could not go away your site prior to suggesting that I extremely loved the usual information a person provide for your visitors?
Is going to be back incessantly to inspect new posts
This article offers clear idea in support of the newest
people of blogging, that really the way to do blogging.
[…] Matrix of Deceit: Forcing Pre-election and Exit Polls to Match Fraudulent Vote Counts Proving Election Fraud: Phantom Voters, Uncounted Votes and the National Poll LINKS TO POSTS Democratic Primaries spread sheet From TDMS Research: Democratic 2016 primaries […]
[…] The explanatory notes for this table can be seen at: https://tdmsresearch.com/2016/06/20/democratic-party-table-2016-primaries/ […]
[…] Matrix of Deceit: Forcing Pre-election and Exit Polls to Match Fraudulent Vote Counts Proving Election Fraud: Phantom Voters, Uncounted Votes and the National Poll LINKS TO POSTS Democratic Primaries spread sheet From TDMS Research: Democratic 2016 primaries […]
[…] Matrix of Deceit: Forcing Pre-election and Exit Polls to Match Fraudulent Vote Counts Proving Election Fraud: Phantom Voters, Uncounted Votes and the National Poll LINKS TO POSTS Democratic Primaries spread sheet From TDMS Research: Democratic 2016 primaries […]
[…] LINKS TO POSTS Democratic Primaries spread sheet From TDMS Research: Democratic 2016 primaries […]
[…] LINKS TO POSTS Democratic Primaries spread sheet From TDMS Research: Democratic 2016 primaries […]
Would you please explain the significance, in layman’s terms, of the last column in the third chart? You only have it calculated out in 12 states, but it looks to be a significant amount in many more states. Take Pennsylvania, for instance. 7.1-2.6%. Thanks!
Daniel,
The last column only notes the states where the discrepancies between the recorded votes and the exit polls exceeds the margin of error of the exit polls. In your example, for instance, the margin of error for the PA exit poll at 7.1% was larger than the discrepancy between the exit poll and the recorded vote at 2.6% and therefore does not satisfy the criteria of the last column.
[…] Primaries spread sheet TDMS Research: Democratic 2016 primaries LINKS TO […]
[…] https://tdmsresearch.com/2016/06/20/democratic-party-table-2016-primaries/ […]
[…] primary is large and beyond the margin of error associated with the exit poll. Like the 2016 Democratic Party primaries, with candidates Clinton and Sanders, all but one of these large discrepancies favors candidate […]