by Theodore de Macedo Soares
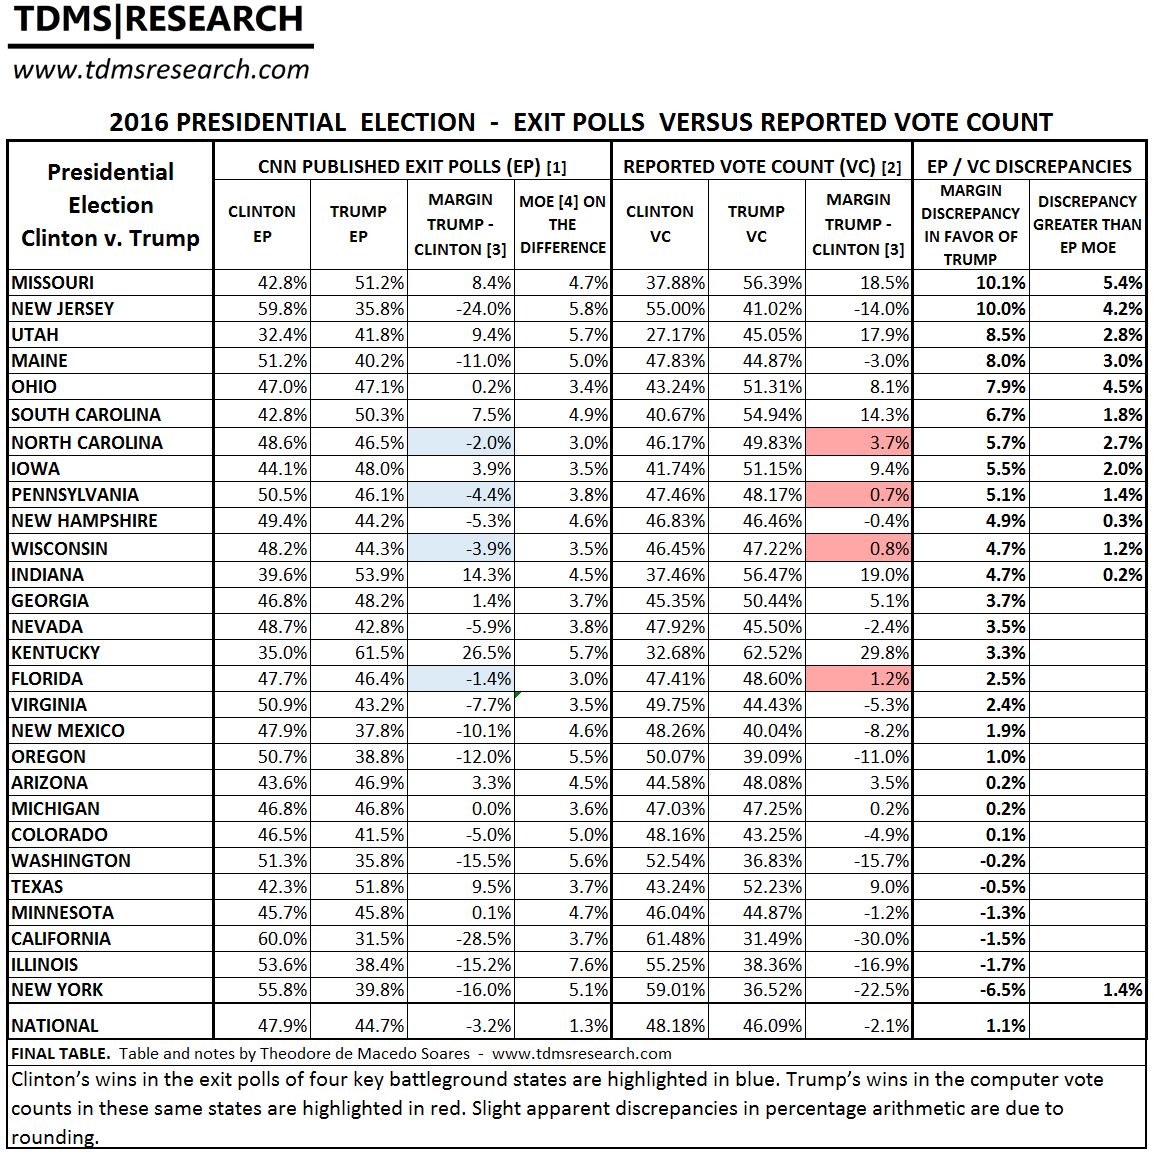
According to the exit polls conducted by Edison Research, Clinton won four key battleground states (NC, PA, WI, and FL) in the 2016 Presidential Election that she went on to lose in the computerized vote counts. With these states Clinton wins the Electoral College with a count of 306 versus 232 for Trump. Clinton also won the national exit poll by 3.2% and won the national vote count by 2.1% or about three million votes.
Exit polls were conducted in 28 states. In 22 states the discrepancies between the exit polls and the vote count favored Trump. In 12 of these states the discrepancies favoring Trump exceeded the margin of error of the state’s exit poll. See Table and its footnotes below.
Readers may find the following answers to questions in the comments section very helpful:
- Discussion on the suitability of exit polls conducted by Edison Research as an indicator of possible election fraud
- Unadjusted exit polls may have shown much larger wins for Clinton
- On margin of error (MOE) including its relationship with the confidence interval
- Simple explanation on the application of the MOE in the table below
- Important distinction between “election fraud” and “voter fraud”
- On speculative theories
[1] Exit polls (EP) conducted by Edison Research and published by CNN shortly after the closing of state polls and downloaded by TdMS. Edison Research conducted one national EP and EPs in 28 states. As these first published exit polls are altered/adjusted to conform to the unverified computer vote counts, the discrepancies shown above are adjusted to near zero in the final EPs.
[2] Official 2016 Presidential General Election Results. Federal Election Commission. January 30, 2017. Available at: www.fec.gov/pubrec/fe2016/2016presgeresults.pdf and archived HERE.
[3] The margin columns subtracts the Clinton totals from Trump’s. A Trump win is shown by a positive sign and a Clinton win by a negative sign.
[4] Note that the Margin of Error (MOE) is for the differences between the two candidates (at 95% CI). This MOE is about double the usual MOE for each candidate. MOE calculated according to: Franklin, C. The ‘Margin of Error’ for Differences in Polls. University of Wisconsin, Madison, Wisconsin. October 2002, revised February 2007. Available at: https://abcnews.go.com/images/PollingUnit/MOEFranklin.pdf
Note: The exit poll vote proportions for Clinton and Trump were derived from the gender category (all the other categories would have approximately the same result). Clinton’s proportion of the male vote was multiplied with the total male proportion and added to Clinton’s proportion of the female vote multiplied with the total female vote to arrive at Clinton’s vote share in the state. The same procedure was applied to arrive at Trump’s proportions of the exit poll vote.
Updates:
May 8, 2017: Table updated with the official vote count published by the Federal Election Commission on January 30, 2017. The table is now marked final. Some of the introductory text has been modified in accordance with the official results and table.
November 14, 2016: As requested by a few people attached is the zip file (very large at 5,300KB) containing all the exit polls downloaded from CNN shortly after the polls closed in each state. If using these files please credit www.tdmsresearch.com and Theodore de Macedo Soares as the source and most importantly cite the article that shows the results of the exit polls: https://tdmsresearch.com/2016/11/10/2016-presidential-election-table/
November 17, 2016: The table below was updated to reflect the most current vote counts. Electoral College count updated to include states not previously decided. Michigan results will not be formally decided until the end of November but as it is expected that Trump will win its 16 Electoral College votes it has been noted as a Trump win. Electoral College results calculated with the interactive map at http://www.270towin.com/
COMMENT SECTION FUNCTIONALITY UPDATED ON NOVEMBER 19, 2016.
Readers can now rate and sort comments.
Thanks for doing this work.
Thanks for reading it and passing the information and link to this article to others!
Why us t this being covered by the media. Why aren’t democrats demanding an investigation.
Because election fraud, be it pre-voting with [mainly] republicans removing people from the rolls through crosscheck, then post-voting (republicans/democrats] altering the vote count, must remain hidden from the public. The illusion of a democracy must remain with the corporate/oligarch media obviously complicit in the crime. Here’s a rare investigative documentary from years back. http://bit.ly/stealing-america
I have been emailing and contacting congress. There is a private group of 3.7 million and counting contacting their reps about this
Where is this group? I’d like to be involved I live in WI
Michelle, follow Andrea Chalupa at Twitter. Good summaries are there. Just scroll down. There are WI phone numbers listed there. https://twitter.com/AndreaChalupa
LOL! shouldn’t you rather be busy packing???
Maybe because the Dems rigged the Primary – and they dont want too many electoral investigations ?
Again. It has been proven that the Dems did not rig the primary and you need to have proof when making such a charge. There is no proof of that. Emails of someone liking the Dem running in the primary doesn’t “prove” anything. Maybe put some salve on that butt hurt.
Sign the petition demanding an audit of 7 states:
http://www.thepetitionsite.com/takeaction/810/285/388/
Screw that. Do an audit of the Democratic Primary first. Hillary got what she deserved. She stole the primary, Trump stole the general. Poetic Justice under a system where there is no other justice. She created Trump and Trump ate her lunch. All is fair.
That is so ridiculous. I voted for Hillary. Everyone I know voted for Hillary. Sanders people act like they were the only voters out there. When Obama beat Hillary in the ’08 primary, the Hillary people didn’t act like petulant brats and conspiracy theorists. There was NO damn election fraud; it was studied closely. Get over it.
The general with Trump is vastly different. The Russians have been all over it.
Yes, the Hillary people did act like petulant brats in ’08; you have a very, very short (selective) memory.
1. Hillary stole the primary in ’16 with the collaboration of the DNC.
2. Rump stole the general election, with the help of the Russians.
3. Dubya stole the general in ’00 and ’04.
Again pathetic. PROVE IT! In fact, the Russians have been proven to have done it, big mouth so shut up. Hillary swamped the old grifter by 4 million votes. HE LOST. The primary wasn’t rigged, bernturds just didn’t like the rules and didn’t want to follow them and that’s on Bernfraud and his minions.
That’s because bernbots are ignorant pathetics that believe every lie the old fraud spews, despite all research, and stats to the contrary. They have no ability to understand how gov’t works.
Go play in your baskets. You bots cost the election.
Nah. The DNC running with an already vastly unpopular candidate lost the election. She lost to Trump. TRUMP. That’s pathetic, even with election fraud.
Wrong stupid. Her favorables were at 67% before she ran. She did not lose to trump, he cheated so…grow a brain.
Mike. I know Republicans and facts do not mix. Maybe try re reading the above article.
Hillary could have easily picked Sanders (or Elizabeth Warren) as her running mate. Instead, John Podesta placed him last on his list of possibles.
http://www.slate.com/blogs/the_slatest/2016/10/18/hacked_john_podesta_email_lists_vp_candidates_by_race.html
The Dunning-Kruger effect is apparently endemic not only to Trump, but also to Clinton AND her supporters.
http://www.salon.com/2016/09/30/idiocracy-now-donald-trump-and-the-dunning-kruger-effect-when-stupid-people-dont-know-they-are-stupid/
Ok…so tell us all why picking the back stabbing liar, Sanders was such a fine idea, huh? He’s full of crap. He’s done nothing for 30 years. Give it a rest.
Hillary Clinton was a very good candidat, and Tim McCaine was a very good choice for VP. What we could have been.
Are you serious? Sanders wanted to become president let him run as an Independent. A democrat? Why now. Hillary campaigned for the job her entire life. She deserved it.
Ii was Hillary’s “turn”, but the public was in the mood for something else.
http://www.slate.com/blogs/the_slatest/2016/11/11/the_democrats_ran_hillary_because_it_was_her_turn_bad_move.html
What was the right thing to do?
You realize you are linking a russian site right?
You dumb fuck. Slate is not Russian, Boris.
I dont know who youre calling a dumb fuck, loser! However, I didnt say Slate was Russian.
You are wrong. Nice right wing rag slate, ya got there too. The public was scammed by Russian bots, GOP propaganda, and trump’s publicity stunts like paying people to cheer for him and pretend they are “fans”. Then the Rethugs had Comey interfere, Russian fake news, and Russian hacks, along with rigged states like WI and voter suppression.
Now run along ding dong.
I agree 100%. Let each candidate stand on their own merits and platforms. Here’s a 3-way election race model done back in May using CNN polling data, but factoring in each candidates popularity with republican, democrat and independent factions. http://bit.ly/sanders-clinton-trump-race
The problem is that 1)Bernies not a Democrat. 2)Democrats dont vote for demagogues like Republicans. 3)Accomplishments matter.
One should not vote for someone simply because we feel sorry for them. Her goals do not trump our goals.
clinton forwarded bush’s policies as senator. if that is her deserving it, she should run as a republican
trump also donated to her foundation; obama opposed the recount; and they sabotaged sanders. i’m all for a recount of the general…. too bad most of the dem reps are republican pets and didn’t support it!
Go home dimwit….no one sabotaged Slanders. He LOST by 4 million votes! You don’t have any idea what you are even talking about.
agree
Seriously, you’re one of those? Pitiful!
Hillary Stole Nothing, jack. So STFU
Exactly.
Hillary won primaries by a landslide, most of Bernies wins came in undemocratic and easily manipulated caucus states. There was such an outcry in Colorado after Bernie won big in caucuses, with elderly women and working stiffs shut out, that the Coloradans voted this fall to replace csucus with a primary.
Don’t forget, only 25m voted in the democrat primary, which is not representative of the 120m voters in the presidential election, where all independents are able to vote. Here’s a 3-way election model done comparing the likely outcome of a Clinton, Trump, Sanders race to give you some perspective who was more popular overall. http://bit.ly/sanders-clinton-trump-race
Listen clown and listen good. We are not going to allow Republicans and dumb Indep.s like you pick our candidate….do you get that? The Democratic Primary does not say that everyone in America gets to choose their candidate….that would defeat the purpose of the primary, but I see you are too butthurt over Bernie’s loss. Well you can’t win an election without minorities. That’s a fact. Learn facts before posting.
‘Poetic Justice’ ??having a gang in the Whitehouse, Senate, and House that all agree that fiefdom is too good for ‘the people’ and that we are being lazy to ask to work fewer than 80 hours per week to pay our rent, and then beg for food……. Legislators that put $2200 lunches on their expense account covered by taxpayers…… because they discussed how seniors were draining the economy by collecting the Social Security insurance the government had FORCED us to contribute a percentage of our wages to…. since the first day we worked…. and how Seniors getting $1100 a month as their total income were wasting the countries resources….. and you [think] the same people are going to reward you for not objecting to the terrorism of “other” ……. you dare to smirk and tell us that we DESERVE to be in fear of our neighbor killing us by order of Trump [he has promised his followers for 18 months that he would allow them to play Rwanda against the neighbors they looked down on]
Prove it
Jack you are saying it’s ok that we have a man like trump in office because they ‘both cheated’ ? Our country is in big trouble.
Jack is a spiteful know-nothing.
See it’s stupid people like you that cause all of the problems and confusion. As I said before, Hillary and Dems and DNC did not “rig” the primary exlax. It was a landslide. She beat that old goat by 4 million votes. Poetic justice would be if something unpleasant happened to that big lying mouth of yours. She created trump? Another moronic know-nothing. Sorry, no, the GOP did so deal with it bernbot.
Post this everywhere! I don’t know how or I would!
I demand a vote audit in those seven states!
It is only 5 days from the election. When it sinks in that in all likelihood a foreign power stole our election, we will take action. Please see the post Hacked at a ParallelWorld.com/news. And sign the petition here:http://www.aparallelworld.com/news/did-a-foreign-power-corrupt-our-election-we-must-know/
Check it out, please. https://www.change.org/p/department-of-justice-request-the-department-of-justice-obtain-an-injunction-against-electoral-college
Actually the NSA is yet to provide some critical data on this, commonly called PROOF. All they said was that it is likely some people outside the US could theoretically hack things, but couldn’t say who or the likely effect. In reality, the main people likely doing the stealing are locals who have more access to the technology and systems. This has been going on for years. http://bit.ly/stealing-america
I was checking CNN, where they don’t have the exit poll vote, per se, but I dove into the other questions in North Carolina (age, party, affiliation, philosophy, etc). Working those numbers seem to imply about a 3-or-so points Trump margin of victory.
Gender, e.g., 46% of the exit poll was male. 39% voted for Clinton, 56% for Trump. The 54% women split 53-45 in Clinton’s favor. That would seem to imply, overall, 50.06% for Trump, 46.56% for Clinton. In North Carolina.
What am I missing?
Thanks!
You missed reading Table note [1]: “…As these first published exit polls are altered/adjusted to conform to the unverified computer vote counts, the discrepancies shown above are adjusted to near zero in the final EPs.”
As the computerized vote totals are counted the exit polls are altered to conform to these counts. Some of these alterations may also occur before the exit polls are published. Also see how the unaltered exit polls may have shown much larger wins for Clinton in my answer below.
Thanks, I did miss that!
Found the CNN Exit Polls- looks like they were already adjusted to match the official results.
David- I’ve contacted Edison Research and asked for an official statement regarding whether the unadjusted exit polls should fall within the MOE of the official election results. I’ve received call-backs but no answer except that the raw data won’t be available until next year. I have extensively analyzed all NC votes and there’s a few significant facts that you need to know- mainly that Trump won ovewhelmingly 55-41% with votes cast on electon day and that Hillary won 50.4- 47.8 in the early “one-stop” votes. Everyone should know that the way the Democratic Primary was rigged in many states was through the early, mail-in, and absentee votes, where Hillary usually scored double digits higher than her election-day percent- just like in NC General election. Additionally, I’ve extensivelty analyzed the precinct-level data and not only does it not appear Trump cheated- Hillary’s excessive gains in the largest precincts don’t follow the demographical distribution patterns of the others. Also, the same can be said regarding the largest counties, where it appears her gains MIGHT be above the demographical distributions of the cumulatives of the smaller counties. Where did you get the demographical numbers you’ve posted- this might just solve this mystery? I’d like to crunch them myself please
Go spread your lies somewhere else. Bernard the fraud LOST by 4 million votes, foot….by a landslide so stfu. You don’t know anything that you posted so stop lying.You contacted no one. More lies. Scram you are a fool and a liar.
Exit polls rely on everyone being honest. Do you think everyone answered truthfully? How many people were embarrassed of afraid to admit that they voted Trump over Clinton.
James,
The voter is given a written questionnaire that is anonymous and is filled out privately. Edison Research tries to duplicate the privacy of voting in a booth, The notion of shy and embarrassed voters has no basis in fact.
Thank you very much, for the info.
Yes! I believe that this is the unaccounted for variable!
Wrong. Why do you just run your ignorant mouth about things you have no clue about?? Pathetic.
According to the latest CNN exit polls (Nov. 15th) in the 4 states you listed, Trump won them all. PA is razor thin 48.43%-48.25%. NC not very close 49.43%-44.95% FL is 47.91%-46.06% and
WI. 48.05%- 45.89%. Within the margin of error except for NC which is a stretch. If you want some good examples of voter fraud look at the Dem. Primaries is the southern states or in California. All of those are obvious. Link for data listed: http://www.cnn.com/election/results/exit-polls/national/president
Correction: Make that Election Fraud
bj,
As noted in the table note [1] above, the first published exit polls are altered to match the official vote count. These altered exit polls are what you see now.
I’m only interested if you include the Green Party.
#HillaryforPrison2016 ← √
Did you even read the article? Trump rigged the election. Not Hillary. You fucking idiot.
I recall an article in the NY Times, many years ago, relaying the conversation between the heads of state of France and Canada in a banquet at the White House. Not realizing the event was being recorded they candidly remarked to each other that if the politicians in their respective countries behaved as in the United States, they would all be in prison,
I live in France, and trust me this place is extremely corrupt. Politicians get busted for misappropriation of funds, keep their jobs, and get re-elected. It’s crazy. The only time they really go to jail is when they’ve pissed off the wrong people. I’m guessing the frenchman was humoring the canadian 😉
Just to make sure I understand correctly, these exit polls are the ones you grabbed before the adjustments right?
If I recall correctly they were talking about the massive amounts of corporate money our politicians receive. What you are referring to in France is just run-of-the-mill crookedness found in all countries.
The exit polls were downloaded almost immediately after the polls were closed in each state and before their wholesale changes to match the computer vote counts. Please do note that as Edison Research assumes that the computer vote counts are accurate they probably alter their exit polls prior to this initial publication to conform with the vote count in progress when they can get this information. See my comment below.
Hey, even Obama admitted that election results are often manipulated. http://bit.ly/obama-voting-machines
WE MUST MAKE OUR VOICES HEARD! Tell the Electoral college DO NOT VOTE FOR TRUMP! It is a Constitutional right and the .Duty of the Electoral College. The Founders brought about the Electoral College to Insure No Man Unfit to be President would ever be elected POTUS by the Electoral College. In MY Opinion and the Majority Opinion, since Hillary Clinton has won the Popular Vote by a Very Large Margin,Donald Trump is the Most Unfit person to ever run for POTUS. Pence is even worse, so no hoping Trump will go to prison to save us. https://www.change.org/p/electoral-college-electors-electoral-college-make-hillary-clinton-president-on-december-19?recruiter=28458950&utm_source=share_petition&utm_medium=copylink
Sign the petition demanding an audit of 7 states:
http://www.thepetitionsite.com/takeaction/810/285/388/
The petition says it was started by Verified Voting, but there is no mention of the petition or this issue on their website. Do you know if this petition was started by verifiedvoting.org?
Take Action now: http://www.aparallelworld.com/news/did-a-foreign-power-corrupt-our-election-we-must-know/
Let’s get this turned around. Donald trump is a crooked dirt bag, sexual predator who has disgraced the American people.
True, but many voters looked beyond Trumps bigotry and scams. They just wanted a change from selfish establishment politics that Clinton always represented. The democrats sabotaged populist Sanders, leaving just Trump to turn to. Hillary was too arrogant. She proudly mocked the Bernie people she needed later in key states. She instead courted donors, republicans and lobbyists. http://bit.ly/hillary-arrogance And Trump was popular with [angry] white males. But he also beat Hillary with the white women vote! http://bit.ly/trump-white-women-vote
Name calling and obscenity is not helpful or even appreciated . It doesn’t change anyone’s mind and is not remotely a rational argument or strategy in debating. It just makes you look small.
In full agreement
maybe Trump supporters weren’t answering polls of any kind (I didn’t and wouldn’t recommend it), including exit polls. Just like with Brexit. When people call you a racist if you support Trump and threaten to kill you and in some cases were beaten badly by Trump haters it has a tendency to stifle responses to polls. Maybe YOU are the idiot.
https://www.youtube.com/watch?v=C7zEibNcejA
LOL..You have the IQ of a hamster. Thanks for making the rest of the country suffer for your ignorance.
Please be civil. This is the type of comment, adding nothing of value, that will be deleted from now on.
xxxxxxxxxxxxxxxxxxxxxxxxxxxxxxxxxxxxxxx
Admin: No expletives. No hatred. Not on this website.
There is always a jerk in the crowd and that you are
[…] –Palast affirms the exit poll analyses suggesting “red shift” manipulation by Jonathan Simon and Theodore de Macedo Soares […]
Where is the original data?
I will be uploading pdf copies of all the exit polls I downloaded on election night. If you would like to see a few of them now write to me using Contact page form
So am I understanding you are submitting this with the idea of POLLS? As in calling and asking “who’d you vote for ?”
This is not gonna work, because obviously it did not pre-election. I suggest not enough Trump voters have a way TO call them by privacy or whatever. Polls are not always right/ I’d like vote counts . THEN it’d be a discrepancy . Not this .
This is silly /
The exit polls are now posted above. The computerized vote count results are widely available from the major news networks,
I’m new to this and not sure how to interpret this data. It appears to me that in the case of North Carolina, exit polls showed a Clinton by +2% but the Reported Vote Count showed Trump by +3.8%. That would be a “swing” of 5.8%. That sounds like a lot. What is considered within the acceptable limit? Doesn’t this big discrepancy indicate fraud?
Yes. It shows voter fraud on the part of the Republican party, who owns 80% of the voting machines, by the way…
What percent of digression between the exit poll and the final tally is considered suspect? 2%, 3% . . ??
Thank you for commenting on this blog. I think you mean election fraud instead of “voter fraud.” “Voter fraud” is the term used primarily by Republicans alleging that as individuals may want to illegally vote more than once that stringent voter ID laws mus be enacted.
Of course the voter ID laws adversely affect the poor, African Americans, and the elderly–the demographics most likely to vote for the Democratic candidates. To my knowledge voter fraud is non-existent as there has been no “voter fraud” prosecution ever in this country.
In any case, “voter fraud” would only amount to insignificant “retail” theft. Potential election fraud is at the “wholesale” level altering the results of elections by miscounting the votes.
Your comment about voter fraud prosecutions being non-existent isn’t precisely true, but it’s close. Here’s a surprisingly interesting study to read, in my opinion, because the occurrences of voter fraud are rare enough that the information can be anecdotal as well as statistical. It’s a little old, but extremely thorough: http://www.brennancenter.org/sites/default/files/legacy/The%20Truth%20About%20Voter%20Fraud.pdf
Election Fraud and voter fraud are very different terms. Analysis of the data from past years shows that Election Fraud is about 7,500 more common than voter fraud – yet the focus is on the latter.
Yes it is a lot. in 13 states the swing exceeded the margin of error for the state poll. The same story occurred in the 2016 Senate races (to be published in the next few days) favoring the Republican Party candidates. The same occurred favoring Clinton in the Democratic Party primaries.
Yes. When the vote count varies from the exit polls by more than the margin of error it is considered to be an indicator of election fraud. As the US Agency for International Development (USAID) stated in their 2015 booklet “[a] discrepancy between the votes reported by voters and official results may suggest that results have been manipulated.”
The bottom line: Our votes are counted by unobservable computer software and the counts are not verified by human counting. To protect the integrity of their elections, in 2009 the Federal Court of Germany (their version of the US Supreme Court) ruled that every aspect of an election must be publicly observable and effectively banned the use of computers to count their ballots. In Germany there is no longer any concern about possible computerized election fraud as now every ballot is now hand-counted in public.
Countries such as Canada, France, Ireland, Italy, Denmark, Finland and 53 other countries protect the integrity of their elections with hand-counted paper ballots. See The Suspect Massachusetts 2016 Primary article
So what then is the margin of error? Are we talking .01% or more? Is 1% acceptable?
So what then is the margin of error?
The margin of error (MOE) in an exit poll is a mathematical function mainly dependent on how many people you sample. In North Carolina, a very large number of people (3,947) filled out the anonymous exit poll questionnaire and the margin of error is calculated to be +-3% (see MOE column in the table).
The exit poll for NC indicated a 2% Clinton win. A vote count within the MOE would fall between a Clinton win of 5% and a Trump win of 1%. The unverified computer vote count came up with a Trump win by 3.8%. This result therefore is 2.8% greater than the MOE for this state (see last column in the table above).
The state with the largest MOE at 5.8% had 594 respondents. The national exit poll with 21,753 respondents has an MOE of only 1.3%.
Thanks, that helps understand the methodology.
Can this information be gotten into the hands of the people who will be voting in the Electoral College? The press? Our Congressional representatives?
I believe your method greatly understates the MOE. The problem comes when you create the weighted average of men and women and use the aggregate number as the sample size. This is incorrect. The weights on men and women are themselves random variables in the elctorate as well as their candidate preferences. You don’t know the fraction of men who voted in NC; only the fraction in the exit polls. The next problem is that the Trump propensity among men and women is probably correlated, but you can’t estimate that propensity. Any positive correlation would raise the MOE again. The article you cite doesn’t look at either of these question, since there is no aggregation step in that article… It makes a huge difference.
“The national exit poll with 21,753 respondents has an MOE of only 1.3%.”
I was looking for this and had trouble finding it. (maybe it’s my fault)
Please put this in LARGE BOLD LETTERS at or near the beginning of the article.
Very much so, the UN regards any discrepancy over 2% spread to be signs of a rigged vote.
NC requires a paper trail for its voting machines, and most counties have a system where paper ballots are fed into an optical scanning machine. Those ballots are now being counted because Republicans have cried foul about losing the governor’s race.
Voter suppression in certain counties played a major role in Trump’s win in North Carolina. Because of a court decision invalidating NC’s early voting law, decisions were thrown back onto the county boards of elections (each with two Republicans and a Democrat) about how to run early voting. Some counties (Wake, Durham) that made early voting generally available had record turnout. Others, which limited and discouraged early voting (Cumberland, possibly Mecklenburg) had unusally low minority turnout.
It would have been easy to get a sampling error in the exit polls because of geographic discrepancies that aren’t usually significant.
Hi, Can you please provide the primary source for this data? I cannot find in CNN exit polls where it shows that Clinton won Pa by 4.4%, for instance. Thank you!
Mary, I will be uploading them later. As noted in footnote 1, Edison Research alters the exit poll values to match the unverified computer vote counts. Meanwhile feel free to contact me via the Contact page form and I can send you the states you are interested in.
Possible use of FOIA requests to verify ballots via types of captured images …
http://blackboxvoting.org/ballot-images/
[…] https://tdmsresearch.com/2016/11/10/2016-presidential-election-table/ […]
Okay, so can anything be done about it? Expose it to all?
Media was too busy talking about f’ing emails anyway.
There was election fraud in Florida in 2000 with the suppression of black voters. I wondered then why the democrats didn’t raise holy hell. I came to the conclusion that it’s because both sides cheat. They will absolutely not touch this, because too many people would end up in prison. That’s my take on it.
That’s exactly it. Because both sides have been doing it for decades. No one will ever be prosecuted, since neither side, or the mainstream media, will ever admit it goes on. The charade must continue.
One thing that can be done is to demand a post-election audit of the paper ballots in key states.
Sign the petition: http://www.thepetitionsite.com/takeaction/810/285/388/
Welcome to the party, Hillary supporters.
The science of statistical analysis led the revolution into modern agriculture in the study of seed test plots and the revolution into modern manufacturing in the development of machine capability. If the statistical results were ignored then as they are in today’s polling results, modern agriculture and manufacturing would not exist. To ignore the science of these results is equivalent to ignoring climate change and its science. As we honor the Veterans who gave their lives for our democracy, we dishonor them with our apathy. Our nation has suffered a coup d’état of third world proportions. Yet we as a nation cower to those who too readily speak of the Constitution and the right to vote while actualizing fraud and contempt for these instruments of democracy. Has our nation become so blind, deaf, and dumb that it will just acquiesce to today’s demigods of power and corruption? Have we become a nation so ignorant of truth and reason that we placidly subjugate ourselves and our nation to people who have no interest in democracy but for how it can be manipulated to serve as a means to their own ends? The science and truth of these exit polls have brought no uproar, no outrage, no calling for a re-election with paper only ballets. The science and truth of these exit polls shout of fraud, insurgency and treason. Our nation now stands on the gallows and the perpetrators of our demise are pulling the lever. Millions of people have suffered horrible deaths over the centuries to bring the ideals of democracy and freedom to birth within our mass consciousnesses and actualized in the formation of The United States of America. We have put great energies and effort to develop a vast military to protect our very existence. But we are now being devoured from within by parasites who perceive our great nation as nothing but fodder for their own feast. We do nothing about the enemy within; within our borders and within ourselves. We have been very cleverly wooed to sleep by people who speak of service and concern yet act to dominate and control. Will we wake up? Will we come to our senses? Will we perceive the deceptions woven around us? I fear I may have only lived to see us die.
Thank you so much for this information. What can we do? Everyone deluge email/call/protest Obama to look into it? Change.org petition to Obama? Getting it in main stream media? I think we actually have some republicans, media, etc. to help, no one who’s using their brain wants reactive Trump to be president and have his hand near the nuclear buttons. I believe this info could change things. (From moment one 11/8 after Trump “chosen” I wondered why no one talking about election fraud/rigging).
Thank you!!!
Sign the petition demanding an audit of 7 states: http://www.thepetitionsite.com/takeaction/810/285/388/
I sent this to every media outlet I thought was worth it. I tweeted this to Clinton, Podesta Bernie etc..
Please do the same.
Put this on every group you belong to, and all the Election fraud pages.
The exit polls were done by the usual NEP, correct? The same people that were the basis of Charnin’s analysis showing Team Hillary stole the glass slipper from Bernie beginning in Iowa then Massachusetts, etc? Then when it became public knowledge that those exit polls were being overturned, they stopped using them, right? So while they stayed out of sight, they were reprogrammed to make sure they confirmed to the rigged polls that had been oversampled, which is one big reason that satanist was overconfident all year and couldn’t bring herself to concede til the next day. Stop The Steal organized an exit-polling operation that indicates Trump actually won 5 MORE states than he was officially recognized for, and they were scrupulous in their neutrality despite the tirades against them coming from pro-Hillary forces. The ONLY way we can assure transparent elections in future is to get rid of electronic voting machines. Bev Harris is the best in the business; you ppl that can’t believe Hillary actually lost should read her site at Black Box voting (not sure of the URL offhand).I know firsthand that nary a single Democrat in my town voted for Hillary, who is probably the most corrupt, greedy, and NON-Democratic party nominee ever.
Do you have a link to the Steal exit polling results?
1. Calculating MOE at 95% CI seems extremely strict. I don’t know if I’ve ever personally seen anything more than 90% used for corporate decision making, and some mature clients even use 80%. At the 90% CI level are they still outside MOE?
2. MOE applies only to sampling error, correct? Isn’t there all kinds of other error, I’m thinking non-response error (do the exit polls show how many people refused to do the survey when asked?). What is the non-response error, is it higher in swing states, and was any effort done to follow up with non-responders or what do we know about non-responders in exist surveys?
3. There is lots of buzz about many people that voted for Trump not wanting others to know about it, given the angry backlash among friends, etc, and perhaps even their own internal angst for voting for the man (but, perhaps feeling a need to vote for him because of singe issue abortion, feeling pressured to vote for him from their evangelical church). Given this, is there a higher propensity in this particular election for non-responders to be more likely to be Trump voters, and/or to false report on exit surveys?
Thanks…
Please. Trump supporters shy of vocalizing their support? Are you kidding me with this?? It’s their very hallmark! No.
Ed, great questions.
1. I agree with you, 95% confidence interval (CI) seems too strict. I use it because it is the standard applied to exit polls and surveys in general. Contrary to intuition, however, when the CI is decreased from 95% to 90% for example, the margin of error decreases. “As the confidence level increases, the margin of error increases…the relationship between confidence level and margin of error seems contradictory to many students because they are confusing accuracy (confidence level) and precision (margin of error). If you want to be surer of hitting a target with a spotlight, then you make your spotlight bigger.” http://inspire.stat.ucla.edu/unit_10/solutions.php . Decreasing CI results in more states exceeding the margin of error and increasing the amount by which states are outside the margin of error. If I decreased CI it would be more suggestive of election fraud.
2. You are correct, the MOE applies only to sampling error. Edison Research attempts to correct for non-response error by noting the demographic characteristics (such as race, age group, gender, etc) of those refusing to fill out the anonymous questionnaires and then adjust their polls accordingly. I discuss criticisms of exit polls in my article https://tdmsresearch.com/2016/07/26/exit-polls-and-computer-vote-counts/ (about halfway down) for Democracy Lost.
3. No doubt that the theory of shy Trump voters will be put forth to explain the discrepancies between the exit polls and the unverified computer vote counts. As I noted in my article noted above, this theory has been debunked for previous elections (see section on youthful voter impact on the Clinton/Sanders races and footnote 19)
im curious as to what can be done with this and do you forward it to any election officials in those states so it can be investigated ? I mean whats the point of sharing this with us if you arent going to do anything with the clear truth of fraud ?
This is a pretty big deal , we are looking at a leader who’s practices runs parallel with Hitler
Millions of marginalized communities are at risk right now ,, and if there is a clear path that can show that these things need to be investigated then it should also be your responsibility to forward it to the proper authorities in the GOP and DEM parties ,,
Hanna,
Exit polls are widely used as a indicator of possible election fraud. By themselves they do not prove fraud.
The most direct way to determine if our votes have been accurately counted by computer “black boxes” is to hand count the ballots. This may be accomplished by making open records act request (similar to FOIA) in states that consider election materials and ballots to be public records. As a reader above commented with this link, http://blackboxvoting.org/ballot-images/, a request for the ballot images is a possibility to consider.
It is up to all of us do demand we follow the example of the many countries that protect the integrity of their elections with ballots hand counted in public view. You are most welcome to spread the link to this article to others,
Shy Trump supporters not wanting to admit to voting for him, given adverse coverage can be counterbalanced by shy Hillary supporters not wanting to admit to voting for her because of pressure from spouse or church or community, etc. advocating strongly for Trump.
There was also plenty of negative comment about Clinton, so there should be very little discrepancy to the accuracy of exit polls, as found elsewhere in the world.
Main news agencies are ignoring this argument. – Norm
Who xxxxxx is afraid to vote for Hillary? Church or community are you kidding me? Trump supporters are called Racist by everybody constantly, the fear of being exposed as a Trump supporter is much greater, and for Hillary it doesn’t exist.
Admin: No expletives.
Wives of Trump voters for a start. Anyone intimidated by expletive bullying invective for another.
Trump didn’t steal anything. I agree that machines were built for fraud and does exist but it wasn’t trump. I’m not sure what the author Means when they say they adjusted this for computer data but guy check shoots off red flags. This election wasn’t clinton and democrats vs trump and republicans. It was clinton and democrats and republicans vs trump. The republican big wigs and funders backed Hillary.
Im very experienced in vote fraud and I can tell you that bush stole 2000,2004 and Hillary stole the primaries in several states like California from Bernie. So she wouldn’t try against trump? Trump had no political pull snd contacts and he couldn’t rig the vote if he wanted. You do know the bush fam supported Hillary right? Look it up. Review bev Harris she was the anti bush crusader and stated that Hillary did try to rig this election just not by enough. I don’t think Obama stole anything but he didn’t fight to fix the systems either…
You say you are experienced in voter fraud. That would be individual voters and fraudulent ballots. This article is about election fraud where the discrepancy comes from the officials counting the votes.
Republicans rigged the primaries in favor of Hillary because they would rather run against her than Bernie. Her disapproval ratings are very high. They rigged the presidential election in favor of Trump and key Senate races (e.g., Wisconsin) so they could take control of the White House, Senate, House, and Supreme Court.
Trump called the election rigged to sucker the Democrats into making big public statements about how it couldn’t be rigged, and then when the rigging comes in favoring Trump, they can’t say a word.
We have just witnessed a very sophisticated subversion of democracy – a quiet coup d’etat.
There were leaks coming out from dark web that computerized voter machines could be hacked and tampered ,,, We are talking about 4 states,,, it would have been a small operation and easily done . He bragged about his relationship with Putin, and The foreign Minister of Russia came out and said they had been in contact with the campaign ,,, You’re daft if you dont think this election was rigged .. MAybe not directly by Trump himself ,, but it would have certainly been possible for those who wanted him in power to do so … But I personally believe he knew and his nefarious public claims of her “rigging” if he loses was him bragging about rigging the election.. its called projection..
I just want to know how the info should go to , or what can be done if any
Where is Massachusetts?
Edison Research conducted exit polls in only 28 states. Massachusetts was not one of the states.
Thanks for the information!
Do you have the raw data that you used to produce the image in the 2016 Presidential Election Table (chart)?
Yes. It will be uploaded soon.
Who fills out the exit polls? Is it volunteer-based? Are the respondents randomly selected?
The respondents are randomly selected, Every fifth, sixth (or some other number) voter is approached to fill out the anonymous exit poll questionnaire. The demographic characteristics (such as gender, race and age group) of those refusing are noted and the exit poll adjusted accordingly.
I wish there could be a Revote and get A Beloved Person in for the People as President. You Better Believe their will be Great Change in America as we Know it. I didn’t vote for him and I will Never Respect him Ever. I feel sorry for all of the up and coming Children who are going to have to Endure Trump and His Basket Hideous Demand’s, all Because People couldn’t get Past President Obama and Hillary Clinton. They aren’t looking so bad now are they.
Mr. Soares, I have a couple of questions for you. I’m a business journalist in New York, but I’m not reaching out to you on behalf of any news organization. I’m just asking as a concerned citizen.
First, let me say I’m with you in spirit. I’m asking these questions only to get a better understanding of your work and to get an idea of how compelling this story might be to a broader audience.
Re: the exit poll data — I went to the Edison Research website. They don’t publish a state-by-state list of the winner. Instead, they publish data on voter characteristics — gender, ethnicity, age, etc.
You say in your “about” section that you used the “gender” results to arrive at an overall winner. I assume that means you used the percentages of men and women who voted for HRC and Trump to get an overall figure of how many votes each one got.
I understand using the gender category, since there can only be two genders, and everyone has to be one the other — theoretically, the gender number should be all-inclusive.
But how do you know that the gender number wasn’t adjusted?
Edison says that they routinely adjust all their exit poll data — in other words, they “conform” it to the actual results — in order to come up with results they think is more truly representative of how people actually voted.
An article published on Raw Story in April quoted an Edison staffer saying two things about their process that make me wonder if their data can be used to create an assumed overall result, as you’ve done.
First, he said the “voter characteristics” exit poll that they do for US elections is not designed to catch voter fraud — it has 20 questions on it, and the sheer length dissuades some people from taking it, which skews the results.
In contrast, an exit poll that’s designed to catch voter fraud, which is used in some foreign elections, typically only has one question on it — “Who did you vote for?” — and gets a much higher response rate.
Second, he said all their data is adjusted, which suggests that the overall results numbers you’ve assumed might not be right.
Here’s a clip from that story:
http://www.rawstory.com/2016/04/on-tim-robbins-election-fraud-and-how-nonsense-spreads-around-the-internet/comments/
I asked Joe Lenski, executive vice president of Edison Media Research, about all of this. Edison has conducted all of the exit polls for major U.S. media organizations since 2003, and Lenski has also done exit polling in Azerbaijan, Georgia and Venezuela.
As for using his results to suss out fraud, he says that American exit polls are “just not designed for that type of precision. They’re surveys, and like any other survey, they have a margin of error. The precision that a lot of these people are talking about just doesn’t exist with our polls.”
In emerging democracies, says Lenski, “the exit polls are designed specifically to catch any manipulations of the vote count, and also to bring some transparency so voters can trust the vote count. They have a lot more locations in the sample, they do a lot more interviews and they use a much, much smaller questionnaire. In some cases, they just ask, ‘who did you vote for?’” A brief questionnaire, he explains, increases the response rate. “The more interviews you do, the more locations you cover and the shorter the questionnaire, the higher response rate you’ll get, and that all leads to a much smaller margin of error.”
The news organizations that sponsor our exit polls are just looking for a sense of who voted, and what motivated them to vote. They use longer questionnaires – typically with about 20 questions – and it takes a little longer for voters to fill them out. Lenski says that while the methodology hasn’t changed much since exit polling was first introduced in 1967, the fact that news organizations post preliminary data in real-time leads to “a lot of commentary on social media.”
When people claim that early exit poll data are “unadjusted,” they’re wrong. Edison adjusts its data throughout the day to compensate for “non-response rates and other sampling issues that come up when we conduct the survey.” When someone is approached to take a survey and says ‘no thanks,’ Edison’s pollster notes that individual’s gender, race and approximate age. They then adjust the raw data to match the demographics of the people they saw voting at that location during the day.
The early data news organizations post on their websites has already been adjusted. In states with large numbers of absentee voting, the data are also merged with phone interviews conducted before Election Day. If the number of absentees is significantly higher or lower than expected, they adjust for that difference as well. And then, finally, the data are adjusted again to match not the results of the election statewide, but the vote tallies at the specific polling places they surveyed.
Lenski stresses that pre-election polls are also adjusted to conform their samples to what pollsters know about the populations they’re trying to measure. The irony of all of this is that the adjusted data are far more accurate than the raw data.
“Remember the process here,” says Lenski. “In most of these states, we’re talking about having interviewers at several dozen locations. The vote returns at those locations are used in the model, and the vote counts at the county level are used in the model, so if there were some sort of fix involved, there would have to be hundreds or thousands of people manipulating the data at all of those locations to make it work.”
So, Mr. Soares, I wonder how would you respond to these points? Do you think it’s statistically valid to use an assumed number for your state-by-state results that’s based on adjusted data for gender? And do you think the fact that these Edison exit polls were long and time-consuming could have skewed the results in way would make your assumed number invalid?
Thank you in advance for your response.
Thank you for your questions on the suitability of Edison’s exit polls as an indicator of possible election fraud.
First it should be noted that we would not be having this discussion (or this website) if our ballots were counted by hand right after voting. Instead our votes are counted by computer software universally proven to be vulnerable to hacking in the election as well as in every other context. These counts are unobservable and unverified by human conducted counts. See comment above. In effect we are asked to take computer generated election results on blind faith. This state of affairs should be unacceptable to any reasonable person.
Without blind faith in the unverified computer counts we are left with exit polls as an indicator of the accuracy of the vote count.
Yes, it is true that Edison Research did not design their exit polls specifically to detect election fraud. It is immaterial that such exit polls would have a greater number of respondents and result in a lower margin of error. The margin of error applied in the table above is specific to the actual exit polls conducted. They designed and executed their exit polls using well established scientific methodology to accurately project the vote proportions of each candidate with additional information on the electorate. As Edison Research assumes the computer count is accurate their mission is to arrive at exit poll results that match the official vote count.
As I wrote in Exit Polls and Computerized Vote Counts “[a]s Mr. Lenski of Edison Research explained, when states such as ‘New Hampshire, Kentucky, Indiana, Florida and Texas (and others) have split poll closing times where part of the state closes at one time and the rest of the state closes at a later time…we may have quite a bit of actual vote returns to use in our estimates that are broadcast…when all of the state polling locations have officially closed.’ [Mr. Lenski, email correspondence]. Although Mr. Lenski did not explicitly state that in other states without split closing times they also used vote returns acquired from the precincts they were polling or from other sources, there seems no reason why Edison would not use them if available.
The problem with altering exit polls with vote returns from computer counts that overwhelmingly favored Clinton compared to the states’ exit polls is that such returns would have depressed Sanders’ exit poll totals even further, resulting in an even larger discrepancy between the exit polls and the vote counts.”
The same applies to the 2016 Presidential election where 23 of the 28 states that were polled had computer vote counts that favored Trump compared to their respective exit polls. In other words, the discrepancies noted in the table above were likely much larger in favor of Trump in the unadjusted exit polls. This is reason for more concern rather than less.
The other adjustments you mention, such as adjusting for non-response rate and early voting are necessary for a properly conducted exit poll designed to project the vote proportions for each candidate.
I am not clear why you focused on my use of the gender category to arrive at the vote proportions for Trump and Clinton. I could have used any of the many demographic or other questions to derive these proportions as they all have the same result.
The quote of Mr. Lenski about hundreds of thousands needed to fix an election is also puzzling to me. The issue in question is computer software common to vote counting machines possibly designed or hacked to miscount the votes particularly in battleground states where one or two counties may decide the outcome in that state. Very few people are needed to accomplish such a task.
The main point is that we should join the many other countries that recognize the vulnerability of computer software and protect the integrity of their elections with hand counted paper ballots in plain view of observers. To do this efficiently we probably need separate federal, state, and local elections instead of what we have now with these many contests occurring in the same day.
Thanks for your response. And let me stipulate that I agree with you entirely about our voting machines being vulnerable to hacking, and about the need to return to paper ballots. No argument from me on that.
But just to dwell on your methodology for a bit longer, you provide a statement above that appears to be quote (or is the quotation mark after “vote counts” an error?). If it is a quote, I guess it would have to be from Lenski, but I’m guessing it’s not a quote, it’s part of your own discussion, and the quotation mark was just a slip of the keyboard.
Let me repeat it here:
“The problem with altering exit polls with vote returns from computer counts that overwhelmingly favored Clinton compared to the states’ exit polls is that such returns would have depressed Sanders’ exit poll totals even further, resulting in an even larger discrepancy between the exit polls and the vote counts.”
In effect, this seems to be saying that the process of adjusting the data to conform to the actual results ends up skewing the results farther away from the true vote count.
But if that is the case — if “adjusted” exit poll results create a less accurate view of the real vote — doesn’t that mean that your assumed overall results, gleaned from the adjusted gender numbers, would also be less accurate?
If I am missing something, please point it out. Thanks.
Thank you for pointing to the lack of clarity in the quotes. the quote from Mr. Lenski is now in single quotation marks within the double quotation marks of the article excerpt.
What I am saying is to the extent that Edison Research adjusted the the exit polls prior to first publication by CNN with incoming computer vote totals these exit polls will be closer to the official vote count. From Edison’s perspective this is good because they apparently believe in the accuracy of the unverified computerized vote count.
The results of such adjustments, however, undermine the carefully designed and scientifically conducted exit polls. It makes them less accurate as exit polls per se.
As the computer vote count in 23 of 28 states show greater margins for Trump than their respective exit polls it is logical to assume that any “adjustments” to the exit polls comprised of increasing Trump’s totals and decreasing Clinton’s totals in order to match the incoming vote counts.
We don’t know the actual adjustments made by Edison Research but many of the disparities between the vote count and the exit polls that favor Trump may have been even larger in the non-adjusted polls than what we see now.
If Clinton’s exit poll totals in states such as Ohio, Michigan, and Georgia which show close races in the exit polls were decreased and Trump’s increased to match the incoming vote totals, these exit polls may have shown her winning these states.
When you add these states to the list of states that she won in the exit polls but lost in the vote count, the unadjusted exit polls may have shown Clinton winning the Electoral College vote in a landslide.
It would be valuable to see the unadulterated exit polls. It would be priceless to have confidence in an election where the votes were openly counted by hand in front of the public as is done in many countries such as Germany, France, Canada, etc.
Got it! Great reply, and I appreciate your patience. I am going to share all this with friends who are also concerned about voter fraud.
In Detroit alone machines recorded- 90,000 ballots left the president choice totally blank. The rest of the ballots were filled in. I wonder how easy it is to (not make a hacked machine flip votes), just hack them to not count -any- presidents vote. We all know Hillary won the popular vote by about 2 million.
Seems to me an extraordinary number of ‘blank’ ballots in a strong D city.
This should be audited counting the paper vote against the tally
Excellent observation!!!
Laura, is there evidence for this claim that 90,000 ballots left the president blank in Detroit? I’d very much like to know, because I believe Clinton lost by less than that over all.
Thanks
ESPECIALLY SINCE HEY FILLED OUT THE ENTIRE DOWN BALLOT WITH DEMOCRATS BUTWE ARE GOING TO FIND OUT WITH HE RECOUNT!
I think this issue alone warrants audit and recount in that it doesn’t make sense at all.
Laura,
Good point.
Am I understanding correctly that it is common practice for exit polls to be changed based on actual vote tallies? If so, how can exit polls be considered good measures of voting integrity? Has a request for unadulterated exit polls been placed with Edison Research?
Thanks for this work.
Because MSMS WANT TO LOOK LIKE THEY GOT IT RIGHT NOT REPORT THE ACTUAL NEWS.
Go to TDMSRESEARCH.COM FOR A GREAT ANALYSIS OF LIVE EXIT POLL IN THE PRIMARY AND GENERAL 2016 ELECTION against the actual count and the discerpancies that are clearly there.
I WONDER IF THAT IS WHY THE DNC IS ALWAYS MUM ABOUT VOTE HACKING WHEN IT IS OBVIOUS SOMETHING HAPPENED.
IT IS STANDARD KNOWLEDGE IN INTL VOTE MONITORING
( UN, CARTER CENTER , ETC ) THAT IF THE VOTE COUNT VARIES FROM THE LIVE EXIT POLL BY 3%
ITS EITHER A BROKEN MACHINE, A BAD COUNT OR MOST LIKELY FRAUD AND IS AN UNVERIFIABLE COUNT. oh sorry about the all caps, its late and I am tired just saw that
Edison Research has been approached many times by Election Integrity activists since 2000 about the adulteration of their exit polls. They have been sued for their unadjusted data and the plaintiffs were denied, and right now Bob Fitraikis, out of Ohio, is suing them for colluding with the MSM to rig the primary elections. Edison Research is aware that they are operating against international norms to adjust the Exit Polls to fit the reported vote totals.
I am fascinated by your research. 2 questions. I am told that none of the precinct counting machines are connected to the internet. Therefore, they’d have to be hacked on site? No? Or is there a aggregate counter that’s connected to the web and thus vulnerable to hackers on a statewide basis. Also, are you certain that Lenski wasn’t saying that they take small results only from precincts where they did samples, then match them up with demographics to alter their predictions, rather than changing the results of their polls to comply with overall results. Because in the first case, the prediction might be more accurate, assuming the demographic predictors hold whereas in the latter, it’s only reflecting the computer counts.
Thanks!
Vote totals can be manipulated in many ways, but one of the most probable is that there are a few people within key computer positions within the election jurisdiction that flip the votes on the Central Tabulating computer as the vote totals are coming in – since some of the machines actually assign a fractional value to the votes the computer geeks can fine tune the flip to a % of the vote.
So that is NOT an external hack, that is an inside job. Other ways include preprogrammed flipping of the vote on the machines themselves – this can be an internal hack, someone within the election jurisdiction, or an external hack by someone introducing the malware into the computers with the smart cards. There are also election fraud schemes that can be perpetrated on the vote by mail or absentee ballots, and also the provisional ballots – those large ballot scanners found in almost all election jurisdiction can be preprogrammed for vote flipping as well – this scheme is most probably an inside job. So you can see there are many ways to rip an election.
Hello – I live in North Carolina, and we have an awesome State Board of Elections (SBoE) that gives pretty detailed data that you can download. In fact, it allows you to drill down and see how candidates performed separately in 1) One-Stop (early voting), 2) Absentee, 3) Actual election day totals, and 4) Provisional.
I found something pretty disturbing in light of the exit poll data that you posted. My question is this: How can I tell if my state’s data was collected ALL on election day? Because your chart says that the raw data shows her up 2%. Even if CNN adjusted the raw data to where it represents the actual election (where she is instead -3.8%) — the fact is that when you isolate just the ACTUAL results from election day, she lost by 15.8%.
So . . . If this exit poll used just voters from election day, then even after CNN adjusted it, it was still 12% off. And with your raw data, it is 3.8% worse than that.
Allow me to summarize some of my findings as I did in a recent email to some progressive groups around the state:
—————-
– One stop voting made up 62% (nearly 2/3) of all votes. Democrats charged out to huge leads in nearly every race (the exceptions were to popular Republicans in Ag and Labor)
– Then – with nearly 2/3 of the vote behind them, they all got MOWED DOWN on election day. Why is this fishy? Because on election day, we have the raw exit poll data with Clinton up 2.1%. Instead, the actual election day results shows that she is down FIFTEEN POINT SEVEN PERCENT.
– Lets sum this up — She wins early voting by 2.8%. She wins exit polling DONE ON ELECTION DAY by about the same margin.
– But the actual election day totals report a 15.7% loss? We call election fraud in other countries if exit polls are off by more than 3% — Here it is 18% off.
– The exit polling I am talking about is from CNN – it is the raw data from before the results were adjusted to match the results. But even the current CNN exit poll results do not show Dems losing by anywhere near what we are seeing in the data from the SBoE.
– My general allegation is that if there is any foul play, it is being done electronically before the county representatives certify and send their results to the state. It is not possible that they are involved.
– My specific allegation is that it is election fraud IN THE EXTREME if we have software vendors selling our counties election database software where they have kept the admin position in those databases. This role can be turned over to the buyer. If they did not inform the buyer of the importance or existence of this vital role, that is fraudulent all by itself. Who controls the admin position in the databases that count our votes?
Also – on election day, our state voted nearly 12 points to the right of its own absentee vote – Isn’t this pretty telling? The absentee vote is mainly elderly people and military – both categories that these exit polls said were won handily by Trump.
Lastly, I analyzed party turnout over early-voting–vs–actual-election-day FOR BOTH parties.
Couldn’t this be very important in showing if anyone has altered our results? I wondered if we could expect to see that both parties would receive about the same percent of their vote in early voting (and then receive about the same percent of their vote on election day).
That DID NOT happen in NC, and I have been checking some of the states around us to see if it happened there.
For example, what happened here is NOT what happened in Georgia (another state near North Carolina that has early voting) . . . In Georgia, both Dems and Reps got about 54% of their votes in early voting, and both Dems and Reps got about 40% of their votes on election day.
In North Carolina, Democrats got 8.5% more of their votes in the early voting than Reps. Then it reversed on election day.
When I analyzed it at the county level, about ten counties had flat numbers like Georgia. Of course, that means they dropped the average I mentioned earlier – Our two main population centers didn’t swing 8.5% . . . . They swung 10.75% (Charlotte) and 12.5% (Raleigh)
You are absolutely on the right track and those numbers you posted far exceed any MOE, and are very fishy indeed – perhaps you could try to FOIA to get ballot images that are stored on your optical scans if your electronic voting systems that were purchased in 2012 or sooner https://www.verifiedvoting.org/verifier/#year/2016/state/37 John Brakey of Audit AZ is really pushing the envelope on requesting and obtaining ballot images from the election jurisdictions – you could contact him for some help. If you do have ballot images to look at then you could arrange your own hand count of the paper ballot images and that would give you a statistical approximation of the true vote counts.
Why is it valid for Edison Research to assume the vote totals are accurate? And even if they do, why should they be permitted to withhold their unadjusted data?
A number of my viewers have sent me this data and I’m finding it compelling. I am considering doing a story on this during the week. If people have more info that would be relevant to understanding and interpreting the data please send it through the contact form at davidpakman.com
Theodore de Macedo Soares,
When will you be uploading the raw source data? I’d like to share this but am reluctant to do so without verifiable origination. Are you able to be more specific than “soon”?
It is uploaded now. See link in the post above.
Thank you
PLEASE READ THE PETITION ENTIRELY AND THEN PLEASE SIGN AND SHARE.
https://www.change.org/p/department-of-justice-request-the-department-of-justice-obtain-an-injunction-against-electoral-college
Im sorry, but I will still like an answer in regards to what can legally be done about this , who can it be submitted to for investigation ?
Hanna, please see my response to your previous comment above.
Diane Feinstein Democratic Senator from California is Co-chair of the Intelligence Committee might be one person. Any democrat in the Senate for that matter. Barbara Boxer is a mover and shaker. She would fight to her death.
Diane Feinstein Democratic Senator from California is Co-chair of the Intelligence Committee might be one person. Any democrat in the Senate for that matter. Barbara Boxer is a mover and shaker. She would fight to her death.
In the Constitution Congress is the last last arbiter regarding election fraud – A challenge regarding a particular state electors has to come from the House (so getting your evidence to your Democratic US Reps will be very important) and then the challenge must be signed by 1 Senator- then there is a debate in Congress – and then both chambers get to vote up or down on accepting the challenge to the electors of that particular state. Congress laid down on its job of determining the validity of the elections in 2000 – the challenge to the FL electors brought in by the House Black Caucus was unsigned by any Senator (Gore called them all up and asked them to stand down – shithead!) and in 2004 when the challenge to the Ohio electors, again brought in by the House Black Caucus, was signed by Sen. Barbara Boxer, and a 3 hour debate about the validity of our elections occurred but then none of the other Democratic Senators voted to accept the challenge (shitheads!)
The Russians , the Republicans , everyone has their pet suspect as to who rigged the machines so that Trump would win. Ask yourself who had the strongest motive and you’ll have the culprit.
It seems pretty clear to me : Bernie Sanders rigged the election for Trump. Sweet revenge.
Haha, hadn’t thought of him, but who knows!
were mail in ballots and early voting taken into consideration? exit polling was most likely only done during election day.
Yes. Edison Research conducts telephone surveys in states with significant early voting and or mail in ballots. The results of the surveys are incorporated into their exit polls.
Telephone surveys? Don’t those undermine the highly representative samples taken at the polling places?
Comparisons to previous elections?
Interesting article. Can early voting and absentee ballots account for some of the discrepancies between the exit polls and the election results?
The NY Times reported that 22 million early votes were cast by October 28th. While Penn. restricts early voting , North Carolina, Wisconsin, and Florida all permit early voting.
http://www.nytimes.com/interactive/2016/10/31/us/elections/earlyvoters.html?_r=0
[…] Evidence of “red shift” as vote totals and exit polls diverge in several states, suggesting possible tampering with vote tallies (or widespread lying by voters in exit polls). http://codered2014.com/possible-election-rigging-seen-exit-polls/ These discrepancies are also noted here: https://tdmsresearch.com/2016/11/10/2016-presidential-election-table/ […]
[…] Integrity blogger Theodore de Macedo Soares drew attention to the bizarre discrepancy between computer counted official vote counts and exit […]
Election Fraud exists, but it is not being perpetrated by one party against the other. That is the bait and switch. The outcome of our recent elections, always favors the military. The CIA would be very happy with a Trump presidency. Shadow government.
[…] Unadjusted exit polls: https://tdmsresearch.com/2016/11/10/2016-presidential-election-table/ […]
There are two things that I don’t understand about the integrity of the exit polls:
1. I understand that in order for polls to be accurate the polling sample needs to be random. Exit polls are not random. Whoever wants to, fills out a form after voting. Maybe Trump voters were less interested in filling out the exit poll questionnaires than Clinton voters. In any case, since the sample is not random, how can it be considered accurate?
2. The real vote in New York favored Clinton by more than the margin of error. Does this indicate possible election fraud in N.Y. in Clinton’s favor?
Thank you in advance.
I want to add that regardless as to whether this specific presidential election actually had election fraud or not, I wholeheartedly agree that the election system should not rely on computer software blindly. Every step of the counting system should be observable. The current situation is insane.
Moshe,
1. “Whoever wants to” cannot fill out the questionnaire. Depending on the size of precinct every 5th, 7th, 10th (or some other number) voter is chosen to participate, This procedure makes for a random selection of voters.
2. The discrepancy in NY was only 0.3% beyond the MOE for the state’s exit poll. The main story of the table above is that 23 of the 28 states had disparities between the exit poll and the vote count that favored Trump and that 13 of these states had disparities exceeding the margin of error for the exit poll.
The same occurred with Clinton versus Sanders in the Democratic Party primaries where the discrepancies overwhelmingly favored Clinton. In contrast the Republican Party primaries saw discrepancies that were evenly balanced between Trump and the other candidates and only two states TX and WV had discrepancies greater than the MOE.
Theodore, I’m going to try to write an article about these results. How do you describe yourself — are you an “election activist”? Do you have any relevant training, maybe in mathematics or statistics? And if you don’t mind me asking, how old are you and what is your profession?
thanks. If the article gets published, I’ll let you know.
Missouri is actually the most suspicious, imo.
There the discrepancy and the discrepancy/MOE, were greatest.
As a clear majority Trump state, people probably were not embarrassed to affirm their support for him, as was my first thought.
It’s a large state, good for stats.
PLEASE BREAK THIS DOWN BY COUNTY IN THIS 4 STATES, AND THEN CHECK IF THE DIFFERENCE HAS A CORRELATION TO VOTING MACHINE TYPE USED. It could be that this difference was due to voting machine hacking. It could also be due to people being embarrassed that they voted for Trump, so they either lied to the exit poll, or avoided the pollster.
Use web data like this link:
http://elections.wi.gov/sites/default/files/page/179/voting_equipment_by_municipality_09_2016_pdf_19011.pdf
The adjusted national exit poll states that 29% of Hispanics voted for Trump, a statistic that La Raza disputes aggressively. Their own polling firm survey put Trump support among Hispanics at 18%. Can you provide the unadjusted national exit poll estimate of Hispanic votes for Trump? Thank you in advance and thank you for your efforts to save this dying democratic republic.
Bernie Ellis, MA, MPH https://m.youtube.com/watch?v=_X-e0F96bTA
Bernie, the “Latino” vote for Trump in the National exit poll was 27%. I’m not sure if this was the first published exit poll. This EP stated that it was last modified at 8:25pm.
[…] Unadjusted Exit Polls: https://tdmsresearch.com/2016/11/10/2016-presidential-election-table/ […]
[…] Unadjusted Exit Polls: https://tdmsresearch.com/2016/11/10/2016-presidential-election-table/ […]
Something that jumps out at me, in 5 of the states that have greater deviation between exit polls and vote counts, New Jersey, Missouri, Utah, Maine, South Carolina, the winner didn’t change. If this is due to deliberate action, then why is it in states that matter less than the 4 swing states shown? I agree that that deviation in 23 of the 28 states favor Trump, and a more random distribution would be closer to 14. Not sure what to make of this yet.
[…] to the exit polls conducted by Edison Research and reported by TDMS Research show that in North Carolina, there was a 5.8 point discrepancy in favor of Donald Trump, which […]
Nice theory man too bad your numbers are made up. I checked the CNN exit polls for you http://edition.cnn.com/election/results/exit-polls/north-carolina/president DJT got 56% of the male vote and 45% of the female vote. Clinton got 38% of the male vote and 52% of the female vote. Men were 46% of all voters and women were 54% of all voters. This means Trump got 56%*46%+45%*54%=50% this happens to be the actual result btw. This also means Clinton got 45.6% of the votes pretty close to the actual result.
Your exit poll numbers are made up and are thus spreading misinformation. I claim therefore that you are in part responsible for the riots going on across the USA and therefore also partialy responsible for the resulting damages.
Niels,
Please read note [1] just under the table. The first published exit polls are altered to match the vote count as you discovered. The actual exit polls I downloaded from CNN were made available for anyone to verify the table. See the link to the exit polls posted in the body of the post.
[…] the results as reported by electronic voting tabulation systems (which, once again, fail to match reported pre-election or Exit Polling results), before a look at whether new restrictions on voting […]
I like your spreadsheet better the one at http://codered2014.com/blog/ in one important way, you include the “discrepancy greater than EP MOE” column, but there is something confusing that will cause the lay people problems in your spreadsheet.
In all but one of the highlighted states the “margin of discrepancy in favor of Trump” column the difference are off by .1%. Ror instance, North Carolina, you show EP margin for Trump -2.0% and margin Trump in vote count as +3.8% so the discrepencies column should show 5.8% but instead shows 5.9%, which will confuse people. I assume this is because of spreadsheet not showing full internal precision and showing only rounded amount?
Good point. I should add a note explaining that the discrepancies you noted are the result of showing the rounded amount.
Dear Mr. Soares and Ms Sara Jane Millard
I am writing an article, and wonder if you could provide two links and specific page numbers:
(1)
To the USAID 2015 document and the specific page number that specifies that “[a] discrepancy between the votes reported by voters and official results may suggest that results have been manipulated.”
I located the DRG User’s Guide 12.4.2015 but could not find that sentence.
Also Ms Millard said above that
” the UN regards any discrepancy over 2% spread to be signs of a rigged vote.”
I would be very grateful for your help,
The USAID 2015 booklet Assessing and Verifying Election Results. The actual quote from the booklet, pg. 5, is “Detecting fraud: Exit polls provide data that is generally indicative of how people voted. A discrepancy between the aggregated choices reported by voters and the official results may suggest, but not prove, that results have been tampered with.” I quoted another source that apparently lightly paraphrased the actual USAID text.
First of all, an exit poll is just that, a poll. I think everyone can agree by now that all the polls had Hillary winning by a substantial margin with only the LATimes poll remotely close to the actual outcome. This is the most recent anecdotal evidence that polls are not hard evidence of the reality of the public mood. Switching back to exit polls where a person is simply asked who they voted for is not even remotely close to being a valid, reliable method to make the determination the author is. Quite simply, anyone whether it’s a telephone poll/online poll/exit poll can give an opposite answer to their true beliefs. I know many individuals that when polled for Trump told them they supported Clinton. It was not only a “troll” answer but with how people have reacted since the election, before the election, many Trump supporters did not feel comfortable openly supporting their candidate.
I’m trying to recreate your table using your data. It looks like you took the gender percentages from the exit polls and applied them to the number of male and female registered voters in the state according to 2010 census data. Am I right?
Dave, exit poll results only from the exit polls. No census data involved. Please read the paragraph just before the table to duplicate my results.
Ah, I see my problem now. I was trying to make the current CNN exit poll results fit the table instead of the November 8th results that you have in the ZIP file. Using CNN’s most recent exit poll results from November 15th does appear to alter the results significantly in Pennsylvania:
Pennsylvania
November 8th (2613 respondents)
Clinton (42% x 47%) + (58% x 53%) = 50.5’%
Trump (54% x 47%) + (39% x 53%) = 46.1%
November 15th (2935 respondents)
Clinton (40% x 46%) + (55% x 54%) = 48.1%
Trump (57% x 46%) + (42% x 54%) = 48.9%
Can you redo your table again using CNN’s most recent exit poll data and post the results in addition to the current table? Thank you.
North Carolina Exit Polls Comparison (chosen for example)
If anyone cares to do the maths to compare the exit polls published by CNN near to the close with those published later, you will notice considerable discrepancies that cannot mathematically be explained. The later publication conforms to the published vote count. But this is impossible. The 330 additional respondents included in the later poll figures cannot be reconciled with the figures and percentages published earlier. Below is a summary:
Donald Trump
(i) Exit poll Nov.8, at 7.19 p.m., ET = 3967 respondents
% of total vote for Trump in poll = 46.51%
% of total vote for Clinton in poll = 48.55%
(ii) CNN final total = 4297 (updated 2:56 pm ET, Nov. 15)
% of total vote for Trump in poll = 50.06%
% of total vote for Clinton in poll = 46.57%
ONLY 330 additional responders were added to the list: 152 male and 178 female
But, the poll percentages increase the male respondents for Trump by 140, while male for Clinton increase by 23. This is impossible. The maths do not add up. Only 152 extra male respondents were added, according to the published data.
Also, increase in female respondents for Trump by CNN final total = 166, Clinton’s increase = 52. Again, the numbers do not tally. Only 178 female voters were reportedly added, according to the figures.
We can see that the percentages do not conform to 100% of the total, as they should. If Donald Trump received 140 votes from male voters, Clinton should have received less than 12, as ‘Other/no answer’ ought to have counted. Yet, numbers for ‘Other/no answer’ go down after the addition to the total responders. This is another inexplicable anomaly:
Male ‘Other/no answer’ : 6% of 1825 = 110
Male ‘Other/no answer’: 5% of 1977 = 99
Female ‘Other/no answer’: 4% of 2142 = 86
Female ‘Other/no answer’: 2% of 2320 = 46
Conclusion: As this pattern is repeated elsewhere, there is enough cause for concern to call for an immediate, independent inquiry. (P.S. I have no personal involvement in the US election. I am just an interested observer from the UK – where exit polls are known to give a clear indication of outcomes and do not mysteriously change post-count.)
[…] valgdagsmålinger utført av Edison Research og rapportert av TDMS Research, var det et 5,8 poeng avvik i favør av Donald Trump i Nord-Carolina, nok til å ha gitt ham […]
very interesting reading, would love to keep up on this.
Anything from CNN is automatically known to be fake, fraudulent for Clinton. CNN had to fake exit polls to try to match their voter/election fraud rigging.
The exit polls are not created by CNN. They are performed by Edison Research. The exit polls I downloaded from Fox and NBC have the same information.
They easily rigged the exit polls in the same way they rigged the pre-election polls and the voting machines. They had to, to try to match everything so they wouldn’t be caught. Only thing they didn’t plan on was the YUGE monster vote of President Elect Trump. Kelly Ann Conway’s internal polls showed the truth, that he was winning.
The hard thing about rendering a conclusion that this is election fraud as opposed to exit poll bias is that it fails to explain why there was such big discrepancies in very blue and red non-swing states, such as Utah and New Jersey. and even if this could be a red herring pincluded by the most evil of genius hackers, why they would gamble on not overcounting as much in states like MI and MN? It seems like the best plan would be to make any overcounting compared to exit polls appear similar to past elections, except that your hacking program would take a few states and skew them slightly if it looked like the result would be close. The way the states stacked up, particularly MN and MI, it doesn’t appear to be the case
In other word, with the risk of getting caught perhaps war (assuming the hacking was by a nation state) or criminal prosecution, your investment of resources would dictate that you included enough swing states so that you had some margin of error. An election-fraud theory does not take this into account, while employing a post-hoc analysis from the already-known results of which states ended up swinging the election
Skeptical, please notice that the articles and tables published in this website do not make speculative theories about who did what, how, and why. We prefer to stick to the data and facts. The exit polls indicate that our votes may not be accurately counted. Our computerized vote counts are not observable and are unverified by human conducted counts.
To protect the integrity of their elections, in 2009 the Federal Court of Germany (their version of the US Supreme Court) ruled that every aspect of an election must be publicly observable and effectively banned the use of computers to count their ballots. The Court also noted that “programming errors in the software or deliberate electoral fraud committed by manipulating the software of electronic voting machines can be recognized only with difficulty.” In Germany there is no longer any concern about possible computerized election fraud as now every ballot is hand-counted in public.
Countries such as Canada, France, Ireland, Italy, Denmark, Finland and 53 other countries protect the integrity of their elections with hand-counted paper ballots. See The Suspect Massachusetts 2016 Primary article
Fair enough. But people are drawing some very big conclusions from the data. Highlighting four swing states assists such conclusions
Doing well in the popular vote is important too. If Trump won electorally, but got massively blown out in the popular vote, Hillary would have more grounds to challenge the election. Keeping the popular vote as close as possible eliminates that concern. So it becomes necessary to steal votes in non-swing states too.
Popular vote is meaningless in a Presidential election, it’s the electoral vote that matters and unfortunately it has become a mere formality and not what the framers intended.
I know popular vote is technically meaningless. What I’m saying is that if Hillary had a gigantic popular vote lead above Donald Trump, public opinion would be more on her side if she decided to challenge the election in a couple key swing states that were close. That’s less likely to be the case if the popular vote isn’t so massively tilted in her favor. It’s a matter of optics.
Is it all possible to get the raw data from Edison, CNN or the like?
In the past, Edison has been extremely slippery. I can’t speak about the present. But I think we should be asking why they get paid for doing such a bad job of predicting the outcome. Maybe if they were forced to open their books to an audit, we might get an answer as to whether there is fraud or not.
It would cost $70K to do it and there’s a gofundme campaign to do just that. https://www.gofundme.com/lets-get-the-exit-poll-results
Of course, what bugs me the most, is that much of the uncertainty could be dealt with by doing a hand recount of the ballots. Does anyone have any idea why neither of the campaigns has asked for this?
“Does anyone have any idea why neither of the campaigns has asked for this?” – Well, I suppose if the final versions of the exit polls do not conflict with the count, people will say, “Oh well, the pre-election polls got it wrong and can’t be trusted – like Brexit.” – Except, this was not Brexit and the count of votes for Brexit was by hand and open to scrutiny.
I doubt anyone expected someone to take screenshots of the penultimate exit polls like Theodore. Surely its time for a Woodward and Bernstein to set to work.
Actually, similar screenshots were done in the last election (by someone else, I believe). Further, the campaigns must be well aware of the situation, these people know what’s going on, they’re pros at this stuff. We don’t need a Woodward and Bernstein, just a manual recount. Even if it’s just a sampling of the precincts. The problem may be that manual recounts are not possible in some places. I think they’re possible in Wisconsin, Michigan, N. Carolina and Ohio, but I don’t think they are in Florida and Pennsylvania. Since only N. Carolina and Wisconsin went Clinton in the exit polls, it may be that it’s not enough. Does anyone know what sort of audit system exists in Florida and Pennsylvania?
Under Pennsylvania law a recount is mandated if a candidate loses by a margin of half-a-percentage point or less. Candidates can’t personally request a recount if they lose by a greater margin, though they could go to court to challenge the election’s outcome. Three voters with $50, however, could file a petition for a recount in each precinct. PA has more than 9,000 precincts.
Since over 60% of PA voters cast ballots on paperless DRE machines, however, it’s not entirely clear how well an audit or recount would work. There’s no paper trail with which to compare the voting machine’s flash memory.
[…] Unadjusted Exit Polls: https://tdmsresearch.com/2016/11/10/2016-presidential-election-table/ […]
The first published exit polls used for this table were last updated at 7:19 pm ET on Election Day. At that time the polls were closed in only seven states. It would be nearly six hours before the polls closed throughout the country. These first published exit polls were also incomplete.
When you use the exit polls currently published by CNN that were last updated at 2:56 pm ET, Nov. 15, Trump wins North Carolina, Pennsylvania, Wisconsin and Florida.
exit polls as reported by CNN, updated 7:19 pm ET, Nov. 8
North Carolina – Clinton 48.6%, Trump 46.5%
Pennsylvania – Clinton 50.5%, Trump 46.1%
Wisconsin – Clinton 48.2%, Trump 44.3%
Florida – Clinton 47.77%, Trump 46.4%
exit polls as reported by CNN, updated 2:56 pm ET, Nov. 15
North Carolina – Clinton 45.6%, Trump 50.1%
Pennsylvania – Clinton 48.0%, Trump 49.1%
Wisconsin – Clinton 46.6%, Trump 48.4%
Florida – Clinton 46.7%, Trump 48.8%
Will you please update the table to reflect the most current exit polls, just as you updated it on November 17th to the reflect the most current vote counts?
Thank you.
Author has explained that several times in the comments. Those final numbers you posted were adjusted to match the vote counts. Original ones are raw.
That explanation is complete nonsense. Those numbers were clearly not the final totals as Dave pointed out. Look at the time stamps.
Israel, Mr. Lenski, the Vice-President and co-founder of Edison Research (the firm that conducts the exit polls for the major news networks consortium) states that they subsequently alter their exit polls to match the vote counts:
“After the polls close and actual results begin to be released, Edison will factor them in. If the returns differ markedly from the exit-poll results, the firm will update its analyses and projections accordingly.
‘We will know shortly after the polls close,’ Lenski said. ‘We’ll have individual precinct results from all the locations where we conducted interviews, so we’ll know how much understatement or overstatement for the candidates we have… and we may re-weight the exit poll results later in the evening to match the vote estimates by geographic region.'” See http://www.pewresearch.org/fact-tank/2016/11/02/just-how-does-the-general-election-exit-poll-work-anyway/
Researcher, thank you very much for your assistance in addressing peoples comments. Note [1] under the table also explains that the currently available exit polls are altered to match the vote counts.
For all you telling us how Bernie could have won can you tell me how he couldn’t get CA Prop 61 passed in a solid BLUE state? I voted for Prop 61 but it was being fought by Merck & Pfizer ads. So supporters got Bernie on board with ads and rallies and it still lost in blue California.
I believe the popular theory isn’t that it wasn’t Bernie or the Democrats that tampered with these election results, but Russia. If Russia does’t have anything to gain with CA Prop 61 passing they wouldn’t have bothered to interfere there.
[…] to the exit polls conducted by Edison Research and reported by TDMS Research show that in North Carolina, there was a 5.8 point discrepancy in favor of Donald Trump, which […]
[…] to the exit polls conducted by Edison Research and reported by TDMS Research show that in North Carolina, there was a 5.8 point discrepancy in favor of Donald Trump, which […]
[…] to the exit polls conducted by Edison Research and reported by TDMS Research show that in North Carolina, there was a 5.8 point discrepancy in favor of Donald Trump, which […]
[…] to the exit polls conducted by Edison Research and reported by TDMS Research show that in North Carolina, there was a 5.8 point discrepancy in favor of Donald Trump, which […]
Thank you for your tireless efforts in your election work. It is clear that the 2016 election requires a full audit, and findings be used as a catalyst for change in how our elections are conducted. Clearly, hand counted paper ballots &/ or saving computerized ballot images is absolutely essential.
Please Join Me in Demanding a Manual Recount of Bipartisan Selected Wisconsin Counties and an inspection of the Computer code used in Wisconsin to investigate a potential Russian hack that may have dramatically changed the result. This could be the tip of an iceberg that prevents the beginning of the end of Democracy as we know it!
Why?
1.Polls in Wisconsin showed Hillary with a significant lead within one week or less of the election My calculated odds of the good polls being that far off are greater than 1 in 100 MILLION based on the largest Poll (Remington) and considering polling in adjacent states that was largely within the margin of error which demonstrates model correctness. A respected poll has never been that far off in modern polling history.
http://www.electionprojection.com/latest-polls/wisconsin-presidential-polls.php
2.Voter turnout in Wisconsin was reported to be at 20 year lows yet Absentee Ballot voter turnout was 98% DOES THAT MAKE ANY SENSE?
http://minnesota.cbslocal.com/2016/11/09/wisconsin-voter-turnout-low/
3.Exit Polls in many swing states INCLUDING WISCONSIN prior to post election weighting showed Clinton with a sizable lead My Calculated odds of Trump winning North Carolina were greater than 1 in ONE MILLION based on the exit polling. Analysis in other swing states show low likelihood of reported result.
https://btx3.wordpress.com/2016/11/16/finally-a-few-are-getting-it-relevant-to-the-election-hack/
4.Russian interference in US Election is now well documented This has never happened in any election in my memory.
https://www.youtube.com/watch?v=AD8zl7vdjp4
5.The Russians attacked the US Election System Shortly Before the Election This happened before in September but never before that to my knowledge.
http://www.nytimes.com/2016/11/17/us/politics/white-house-confirms-pre-election-warning-to-russia-over-hacking.html?_r=0
Do we really need more evidence before we would want to at least run a cursory check of the integrity of our vote.
This is not a democratic or a republican thing, This is not anti-Trump.
Please Please appreciate – Trump today maybe George Soros tomorrow. Russia today maybe a terrorist network in 2020. The election of Donald Trump was a one in a million event.
With hacking into our election system well documented to not even suspect foul play is naive and dangerous. I have no doubt Donald Trump suspects this.
We owe it to those who have given there lives for this country to defend the integrity of our Democracy with the same vigor as they fought. I only pray that if I was a Trump supporter I would still be demanding this.
This is our choice America! Keep our Democracy or cede in to the top hacker.
Thank you for doing this. I am trying to get the word out ever since I found this. I knew something was off even though I cannot analyze it like you can. Thank you for the confirmation.
[…] by election researcher Theodore de Macedo Soares, seen in the table below on this page as well as available at this link, compared to an ongoing tally of raw votes totals posted at this link by Dave Wasserman of Cook […]
Where is the petition. Journalists need to investigate this before January. We the people should be informed.
Where is the petition? Journalists need to know this. We the people need to know!
How are you getting the CNN published exit poll numbers as total vote for each? I calculated Penn. to the same result you got by using the male and female totals added together, but I do not get the same result you got for Florida.
My math for Florida:
Clinton male (3997*0.47*0.43) +
Clinton female (3997*0.53*0.50) = 1866 votes and 46.71%
Trump 3997*0.47*0.52+3997*0.53*0.46 = 1951 votes and 48.82%
Daniel, great that you attempting to verify the results in the table above. You are using the currently published exit polls that have been altered to more closely match the computer vote counts. See note [1] under the table. Please use the exit polls (I made them available to download. See link supplied above the table) published before these alterations.
[…] bommet målingene i de fleste statene betydelig, og ganske konsekvent til fordel for Clinton. (Dette skjedde også bl.a. i 2004, da disse målingene spådde seier til […]
It seems to me that elections have been stolen since at least 2004 by flipping a few proprietary (non-auditable) voting machines in a few precincts in a few swing states. My question is: Why do Democrats allow it?
It appears imperative that for the integrity of the democratic process, vote recounts in highlighted states (at a minimum) are necessary. Does someone know of efforts in any of those states to bring legal action/injuction? If so, who would we contact in order to lend support, monetary and otherwise?
I personally think that California or some other state with verifiable vote counts should sue those states that do not and make the claim that those states cannot cast electoral college votes until the votes have been verified.
I also do not understand why the democratic party is not taking action.
What is the precedent for this kind of discrepancy? Has it happened in other elections? If not, then something definitely smells fishy.
Want to share my experience at http://www.270towin.com/ election night. I was refreshing the site results (along and others) as tensions were growing after seeing that the election was not going as the polls had predicted. This was before Virginia was called. The website went down (404 error) for about a minute and then it came up with all the numbers drastically tweaked (to the absurd) and every state on the map was completely red. I hit refresh and it was the same and then after about 30 seconds of refreshing it went back to the previous results. FREAKED ME OUT and I emphatically told my buddies that I thought Russia had just hacked 270towin.com. We turned TV from what we were watching on pbs to msnbc just in time to see the guy struggling with the flat screen and they explained they would take a commercial break and fix, as they described it, their flatscreen’s connection issues. PBS seemed to be having tech issues as well accessing the data. But even if everything went as polls had predicted and Hillary had won, after seeing the site go down and numbers and map go crazy for Trump and then go back again, I would still be totally freaked and concerned that there was some seriously undemocratic hacking going on in our election.
please put the American people’s mind to rest. We need a complete audit of voting in this election.
PENNSYLVANIA REGISTERED VOTERS: Please call your voter complaint hotline @ 877-868-3772 to notify your Secretary of the Commonwealth about Theodore’s work and the need for a recount.
Deadline is 11/23!!
Complaint form can also be submitted but doesn’t sound like that will do anything:
https://www.pavoterservices.state.pa.us/Pages/ReportElectionComplaints.aspx
Please share with your PA friends and family.
Thank you!! Dana
Can you explain how the EP data is ‘adjusted’ after the fact? Because these aren’t the numbers you see if you go to CNN now.
See note [1] in the table. Theodore also explains further in comments that the EP numbers you see now on CNN have been adjusted with the electronic vote counts that became available (which I assume would mask the problem).
Based on my calculations using the CNN reported exit poll data (http://www.cnn.com/election/results/exit-polls/national/president), your numbers for NC, PA, WI, & FL are bogus. Where did you come up with your numbers?
N.C.:
Exit Poll: Trump = 50.06% / Clinton = 45.56%
Actual Votes: Trump = 50.54% / Clinton = 46.7%
PA:
Exit Poll: Trump = 49.05% / Clinton = 47.95%
Actual Votes: Trump = 48.79% / Clinton = 47.65%
WI:
Exit Poll: Trump = 48.93% / Clinton = 46.63%
Actual Votes: Trump = 47.87% / Clinton = 46.94%
FL:
Exit Poll: Trump = 48.82% / Clinton = 46.71%
Actual Votes: Trump = 49.06% / Clinton = 47.79%
Hello Israel, See note [1] in the table. Theodore also explains further in comments that the EP numbers you see now on CNN have been adjusted with the electronic vote counts that became available (which I assume would mask the problem).
I can’t believe he is trying to pawn this off as legit. That explanation is completely ridiculous. Look at the time stamp on the .pdf files he linked to. Those are simply the early numbers that don’t represent the final exit poll tally. Do you think we are that dumb? You can easily verify this by viewing the other news outlets reporting of Edison Research’s exit poll numbers.
Look at his ‘data’ for Ohio for instance to see how his numbers are completely bogus…
He says the final exit poll data was 47.0 Clinton to 47.1 Trump.
In reality, using the REAL exit poll data from Edison research, it was 52.11 Trump and 42.89 Clinton. If we compare it to the total reported votes which were 52.05 Trump and 43.51 Clinton, it is crystal clear which numbers were correct.
If anything Clinton received some anomalous jumps compared to her exit poll numbers and still lost handily. Deal with it.
Israel, other commenters and I have repeatedly pointed out to you (and others) that the first published exit polls are the most reliable because these exit polls are then altered to match the unverified computer vote counts.
In my comment to you https://tdmsresearch.com/2016/11/10/2016-presidential-election-table/#comment-1354 the link supplied has Mr. Lenski, the Vice-President of Edison Research (the firm that conducts these exit polls for the networks) stating that they alter these exit polls to match the vote count.
Your comments will be left up as an example of someone willfully attempting to misinform others. Future comments from you in the same vein will be marked as spam and deleted.
[…] Theodore de Macedo Soares | 2016 Presidential Election Table | TDMS|Research […]
[…] haven’t sorted out the Exit Polls yet, but the usual rumors abound–that the difference between the vote tally and exit polls are outside the margin of error in those four states. Oh, and Clinton won only in counties in […]
ITS A DONE DEAL LIBTARDS! You can dream up all the fantasy charts you want! If I were you I’d be really busy packing instead of this nonsense!
I don’t have any political interest, but the screenshots of exit polls before the final ‘post count’ exit polls were released – that you find on CNN and elsewhere, tell a different story to the one that many have been led to believe. This is why the percentages shown in Theodore’s charts are not those that are now reported. (Yes, incredible as it may seem, Edison adjusted the exit polls to match the counts.)
Admin: See my comment to you at https://tdmsresearch.com/2016/11/10/2016-presidential-election-table/#comment-1381
[…] [5] https://tdmsresearch.com/2016/11/10/2016-presidential-election-table/ […]
[…] calls were fueled in large part by the observation of some election data analysts that the reported results in those states were markedly different […]
[…] November 14, 2016: As requested by a few people attached is the zip file (very large at 5,300KB) containing all the exit polls downloaded from CNN shortly after the polls closed in each state. If using these files please credit https://www.tdmsresearch.com and Theodore de Macedo Soares as the source and most importantly cite the article that shows the results of the exit polls: https://tdmsresearch.com/2016/11/10/2016-presidential-election-table/ […]
[…] from senior intelligence officials that Russia had sought ways to influence our election. Analysis of election results by TDMS Research has shown that the discrepancy between exit polls and official vote count favored Trump in 23 […]
How much might it cost to have proper, people funded exit polls? And is there an organization which might be willing to organize them?
[…] 2016 Presidential Election Table by Theodore de Macedo Soares for TDMS|Reseasrch. [Added 11/29/2016] This shows the discrepancy between exit polls and official votes in 28 states. In 12 states, Trump’s margin of victory was greater than the margin of error in the exit poll; in four states—North Carolina, Wisconsin, Pennsylvania and Florida—the exit poll favored Clinton and the official vote favored Trump. In one state, New York, Clinton’s margin of victory was greater than the margin for error in the exit poll. […]
[…] Exit poll discrepancies: https://tdmsresearch.com/2016/11/10/2016-presidential-election-table/ […]
I wrote this op-ed for the New York Times. The odds are it will not get in, because they get lots of unsolicited op-eds. So, I’ll post it here, since you are the poll watchers.
————–
Trump said our election system is rigged. Now, like a troubled teen, he lashes out against recounts in Wisconsin, Pennsylvania, Michigan, whose results may prove the ironic truth of his unsupported (and no longer self-serving) claim. What happened? Perhaps he saw the data I saw. Perhaps that is what scared him. I read the analysis of poll-watcher Theodore de Macedo Soares, who found that exit polls showed that Clinton won the election in four battleground states (FL, NC, PA and WI) while the official computer count gave them all to Trump. In fact, 22 out of 28 states shifted in favor of Trump, 13 of them by more than the 95% confidence limits of the poll. On average, we should see only 1 in 20 shifts that exceed that limit, not 13 in 28.
Were the exit polls a 145,860,530-to-1 statistical aberration? I wouldn’t bet on it any more than I would bet my house on a lottery ticket.
Don’t get me wrong. I am not saying the election was rigged. I am saying, if it were, how would we know?
The answer is manual vote audits of every election. They are easy and cheap. You just select a random (truly random!) subset of the paper ballots and hand count them. You do this in every county. If the hand count differs from the machine count by more than the 95% confidence limit, you hand recount the whole county. If the hand recount differs from machine count by more than the 99% confidence limit in any county, then you hand recount the whole state. You would also have to test for small systematic deviations across counties to protect against a state-level hack. Sound do-able? If there is nothing nefarious happening, an expensive state-wide recount will almost never happen. But if the vote tabulation was tampered with, it will almost always be caught by this method.
All states have election audit/recount laws in place. But in many states the laws are flawed. For example New Jersey has electronic voting with no voter verifiable paper trail and therefore no way to manually count the votes, yet they have statutes in place that require public audits! (The NJ vote deviated from the exit polls by a staggering 10.7% in favor of Trump.) Pennsylvania, too, has an audit problem, and Jill Stein is currently suing that state for not being able to uphold its duty to a candidate-initiated recount because much of the state has no paper trail. Some states audit only at the local level, ignoring well documented vulnerabilities to hacking at the state level. And in some states, Wisconsin included, problems found in the audit do not trigger a state-wide recount. In most states, those who challenge to results must pay huge sums, meet challenging deadlines, and can still face legal challenges before a recount is even initiated. Oh, and if in you want to double-check my exit poll numbers, you can’t use the publically available data on CNN because that gets “adjusted” after the election to match the reported returns, masking any descrepancies. With all of the fees, deadlines, obfuscations, and obstacles, its no wonder we prefer to take our electoral system on faith.
The way I see it, our electoral system is like troubled teen — outwardly healthy, broken on the inside, prone to denial, and not good on tests.
Excellent! I hope you get this piece published somewhere. The more credible, thoughtful voices such as yours are heard in public, the sooner we can address widespread violations of election integrity in the United States.
She cheated, and if Trymp did win by election fraud (I don’t think he did, I think the exit pillars were lying to the pollsters) then she got beat at her own game! This country is way better off without another Clinton in politics!
If one compares the 11-17-2016 updated vote count,and the Exit Polls at the close of polls on 11-8-2016 (all shown in this sites table) some interesting data emerges :
Exit Poll prediction vs Vote Count in California show 0.0% difference, and in Texas there is only a 0.3% difference, as of November 17, 2016. These are large diverse states and yet the Exit Polls are near perfect predictors of the vote count, which is a substantial deductive proof that Edison Research has the sampling science down to a high degree of accuracy.
Yet, when the exit polls show significant, beyond the statistical margin-of-error, differences in the vote count in the swing states, the exit polls are ignored and not spoken of as pointing to possible vote count manipulation?
[…] http://www.cnn.com/election/results/states/nevada Exit poll table: https://tdmsresearch.com/2016/11/10/2016-presidential-election-table/ […]
[…] Now NEP reporters maintain a fiction that American elections are “always fair.” With widespread Republican suppression of nonwhite, poor, and elderly voters in many states, this fiction is, on the face of it, bizarre. On behalf of the American people, the news media could have demanded fairness. Instead, in the 2016 presidential election, NEP corporations—excepting CNN—ceased to report Edison’s initial exit polls at all, even though Edison conducted such polls in 28 states (Theodore de Macedo Soares, co-author of the Election Justice report on the Democratic primaries, recorded these numbers). […]
[…] https://tdmsresearch.com/2016/11/10/2016-presidential-election-table/ […]
Thank you for doing this work! I have one question on your calculations of the 95% confidence interval margins of error. I was trying to see how you calculated the 3.8% MOE of the difference for the Pennsylvania exit polls, using Charles Franklin’s paper that you attached, but I keep getting 7.108%. I’m using the equation for the MOE for difference in a single question, where p1 = 0.505, p2 = 0.461, n=2935, the critical t value as 1.96, and I’ve been multiplying the final answer by 2. What am I missing?
Also do you happen to have the raw numbers for the exit poll data? i.e. a more precise figure than 50.5%?
[…] after the alleged victory of Donald Trump, Theodore de Macedo Soares posted a stunning chart on his electoral integrity blog, TDMS|Research. After downloading, crunching, and […]
[…] Table credit: TDMSResearch […]
[…] to the 2016 exit polls, Clinton was expected to win the battleground states of North Carolina, Pennsylvania, Wisconsin, […]
[…] to the 2016 exit polls, Clinton was expected to win the battleground states of North Carolina, Pennsylvania, Wisconsin, […]
[…] to the 2016 exit polls, Clinton was expected to win the battleground states of North Carolina, Pennsylvania, Wisconsin, […]
Election should be voided.
Yes thank you for this. I knew it, but ….why should we allow this cheating pig to stay in the WH? Forget impeachment…..he needs to be thrown out on his butt along with the scum that helped him. I hope people will march over this and not claim it’s “fake news”. I’m so sick of them getting away with this. It has to stop!
[…] for president in 1988 and Democrats in 2016 won a series of down ballot offices. According to exit polls conducted by Edison Research, Clinton won four swing states (NC, PA, WI, and FL) that she went on […]
[…] for president in 1988 and Democrats in 2016 won a series of down ballot offices. According to exit polls conducted by Edison Research, Clinton won four swing states (NC, PA, WI, and FL) that she went on […]
[…] for president in 1988 and Democrats in 2016 won a series of down ballot offices. According to exit polls conducted by Edison Research, Clinton won four swing states (NC, PA, WI, and FL) that she went on […]
“In 22 states the discrepancies between the exit polls and the vote count favored Trump.”
Please learn how to write clearly. A “discrepancy” is a symmetrical concept and does not favor anyone.
re: Michael Pace “Please learn how to write clearly.”
Please learn how to read correctly. That sentence was quite clearly written and means that in 22 states where there was a significant difference between exit polls and results, Trump’s result was better than in the poll.
What would be helpful here is a listing of which states have paper ballots and which use electronic machines which really can’t be audited. I live and vote in the one state that was outside the margin of error, but favored Clinton. That was New York. It uses paper ballots, so they could do a recount if needed. To be fair, it’s hard to imagine why the votes would not have been correctly counted in New York. Clinton was going to win and didn’t need any help. That makes me wonder how well the exit polling was done. It’s not rocket science, but that doesn’t mean it was well done.
Fox News wants to “computerize” the exit polls as well:
“Associated Press And Fox News Launch Project To Replace Exit Polls”
https://www.npr.org/2018/05/20/612747615/associated-press-and-fox-news-launch-project-to-replace-exit-polls
[…] election researcher Theodore de Macedo Soares, seen in the table below on this page as well as available at this link, compared to an ongoing tally of raw votes totals posted at this link by Dave Wasserman […]
Provisionals. NSA subcontractor Reality Leigh Winner was jailed (post-election) disclosing Russian probes of registration DBs. The Rs, among multi-pronged suppression attack, along with Russia know the game is hacking the registrations. Voters pushed to provisionals which they assume counted. (Name wrong, wrong precinct, Crosscheck, b-day off, provision. The ones that don’t throw up their hands and just leave.) Voter who bothers with provisional tells exit pollster they voted for X, computerized tallies minus dismissed provisionals = discrepancy. Dems didn’t turn out as expected? Only in R controlled firewalls? And Penn with recent legacy of R legislature’s voter ID. 2020 will not be subtle. It will be an overt attack to secure the election as not quantifiable. 35% base fired up does not win. But does act as accelerant. Loss = jail. Jail? Or martial law. Dictatorship. https://www.theatlantic.com/magazine/archive/2019/01/presidential-emergency-powers/576418/
Hello, for those interested in design or choosing
project for construction, found a good catalogue
beautiful project.Many projects of different design.
That’s interesting by the way 24ce6ec
[…] The computerized vote counts has the Republican Party with a two seat advantage. Like the 2020 and 2016 presidential elections and the 2016 U.S. Senate elections the 2020 US Senate races show almost all […]
[…] The computerized vote counts has the Republican Party with a two seat advantage. Like the 2020 and 2016 presidential elections and the 2016 U.S. Senate elections the 2020 US Senate races show almost all […]