By Theodore de Macedo Soares
Edison Research conducted exit polls in seven of the 12 states holding elections for state governor in 2016. In two of these states, Missouri and New Hampshire, the exit polls projected the winner to be the Democratic Party candidate but the computerized vote counts declared the Republican Party candidate the winner. The contest in North Carolina is still undecided.
The discrepancies between the exit polls and the computer based vote totals favored the Republican Party candidate in all contests. In four states the discrepancies exceeded the margin of error of the exit poll.
The link Exit Polls_2016-US-State-Governor-Elections contains the exit polls downloaded from CNN shortly after the polls closed in each state. If using these files please credit www.tdmsresearch.com and Theodore de Macedo Soares as the source and most importantly cite the article that shows the results of these exit polls: https://tdmsresearch.com/2016/11/21/2016-us-state-governor-elections/
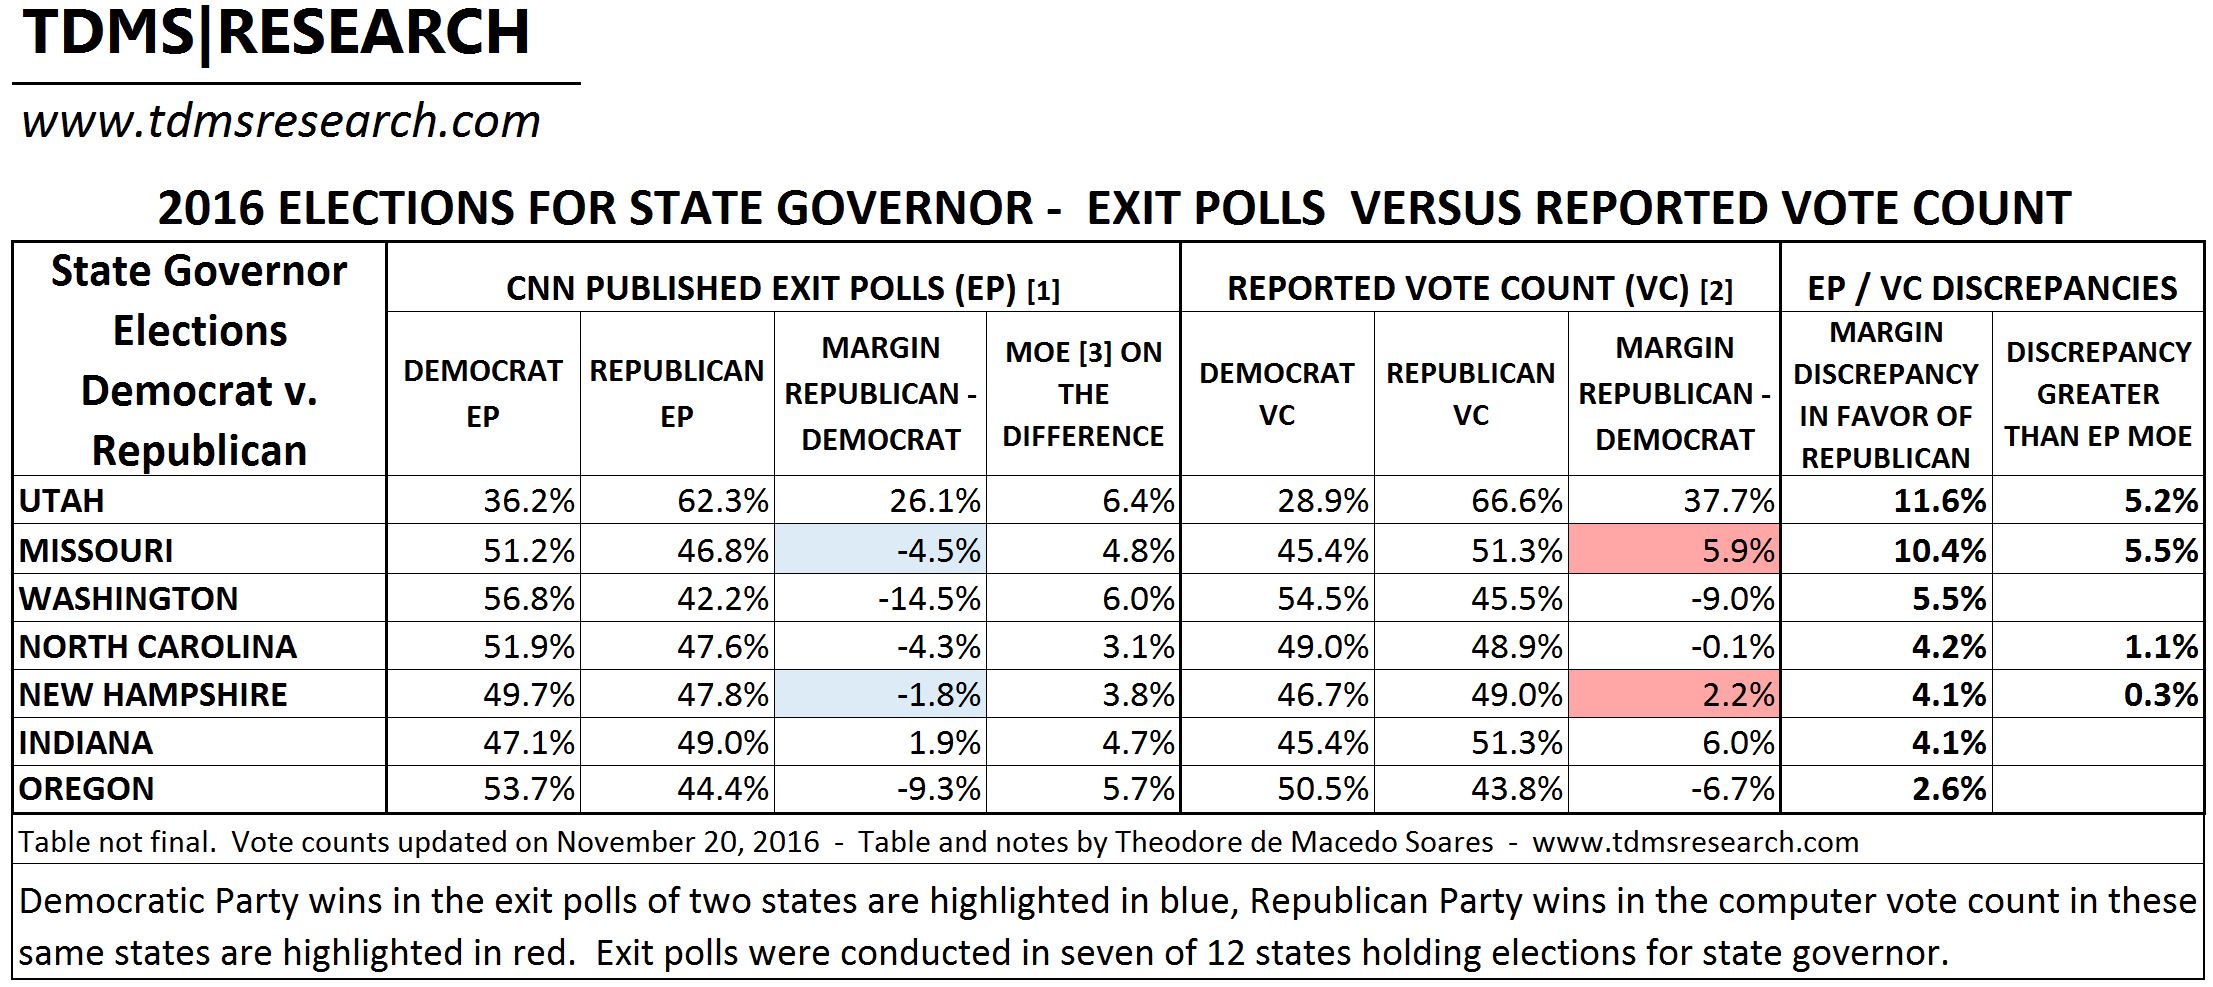
[1] Exit polls (EP) conducted by Edison Research and published by CNN shortly after the closing of polls for the state and downloaded by TdMS (MO by Jonathan Simon).The exit poll vote proportions were derived from the gender category (all the other categories would have the same result). The Democratic Party candidate proportion of the male vote was multiplied with the total male proportion and added to the Democratic Party candidate proportion of the female vote multiplied with the total female proportion to arrive at the candidate’s vote share in the state. The same procedure was applied to arrive at the Republican Party candidate proportion of the exit poll vote. As these first published exit polls are altered/adjusted to conform to the unverified computer vote counts, the discrepancies shown above are adjusted to near zero in the final EPs.
[2] New York Times reported vote count. Last updated on November 20, 2016. http://www.nytimes.com/elections/results
[3] The margin columns subtracts the Democratic Party governor candidate totals from the Republican Party governor candidate. A Republican Party candidate win is shown by a positive sign and a Democratic Party candidate win by a negative sign. Due to rounding some totals may appear slightly inconsistent.
[4] Note that the Margin of Error (MOE) is for the differences between the two candidates (at 95% CI). This MOE is about double the usual MOE for each candidate. MoE calculated with multinomial formula discussed in sections 2 and 4 in: Franklin, C. The ‘Margin of Error’ for Differences in Polls. University of Wisconsin, Madison, Wisconsin. October 2002, revised February 2007. Available at: https://abcnews.go.com/images/PollingUnit/MOEFranklin.pdf