by Theodore de Macedo Soares.
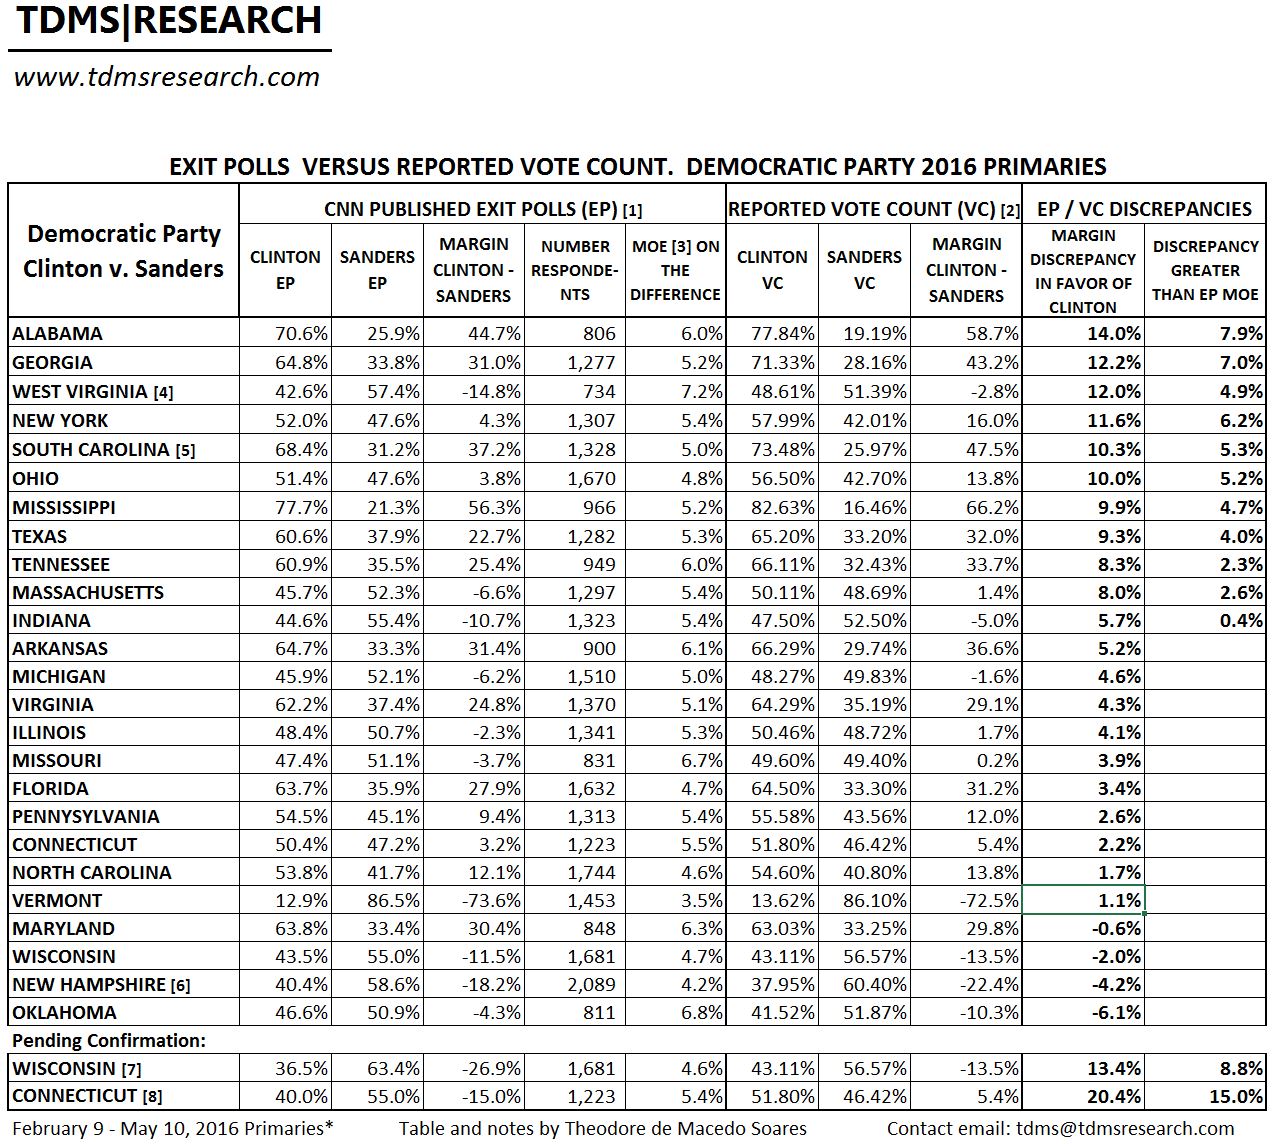
Democratic Party 2016 primaries. This table, Democratic Party Table 1, compares the results of candidate Clinton and candidate Sanders applying the standard margin of error calculations.
Table show the discrepancies between exit poll results and the unverified computer vote counts. Discrepancies that exceed the margin of error (MOE) of the exit polls are shown in the last column. The MOE applied is the standard formula used when the news media and others report survey results. This MOE only addresses the statistical sampling error associated with the size of the sample. As the size of the sample increases, the margin of error decreases.
Presentation of exit poll results are often criticized because the standard MOE formula does not address all the other possible errors common to all surveys. The accompanying table, Democratic Party Table 2, addresses this criticism by taking into account the total survey error (TSE) calculated by comparing 106 exit poll results for the main candidates in the Republican Party primaries with the official vote counts.
Some analysts have applied a MOE increased by 30% to exit poll surveys to compensate for their design effect. This increase, ostensibly based on Merkle and Edelman (2000),* is questionable. Merkle and Edelman based their findings on the 1996 Presidential race exit polls that do not necessarily apply to exit polls conducted 17 years later by a different polling firm. Additionally, no details or calculations were published to support their design effect findings. Coincidentally, the total survey error calculated for the 2016 primaries increases the standard MOE by 32% which is very close to the 30% increase in the MOE applied by other analysts.
* Merkle, D.M. and M. Edelman. 2000. A review of the 1996 voter news service exit polls from a total survey error perspective. In (P.J. Lavrakas and M. Traugott, eds.) Election polls, the news media, and democracy. Chatham House, New York.
[1] Exit polls (EP) conducted by Edison Research and published by CNN shortly after the closing of polls for the state and downloaded by TdMS. Copies are available. Exit poll results are derived from the gender category–the proportion of men and women voting for each candidate. As these first published exit polls were altered/adjusted to conform to the unverified computer vote counts, the discrepancies above are adjusted to near zero in the final EPs.
[2] New York Times reported 100% vote count (99% for NY, CT, MD, PA Primaries 6/12/2016). http://www.nytimes.com/elections/results
[3] Margin of Error (MOE) is for the differences between the two candidates (at 95% confidence interval). This MOE is about double the usual MOE for each candidate. MOE calculated according to: Franklin, C. The ‘Margin of Error’ for Differences in Polls. University of Wisconsin, Madison, Wisconsin. October 2002, revised February 2007. Available at: https://abcnews.go.com/images/PollingUnit/MOEFranklin.pdf
[4] The Democratic Part primary in West Virginia was unique in that a large part of the discrepancy disfavoring Sanders occurred by an 8.3% increase in the vote totals for minor candidates than predicted by the exit polls. To show this discrepancy in this table, for this state only, the exit poll totals and vote totals for the other candidates were added to Clinton’s columns and the resulting discrepancy shown is between Sanders and Clinton combined with others.
[5] Exit poll published by NBCnews.com at 7:02 PM on February 27, 2016. Downloaded by Jonathan Simon of Election Defense Alliance. EP number of respondents estimated by subtracting 133 respondents (average addition of respondents in all final adjusted Democratic Party state EPs with greater than 1,000 respondents) from 1,461 respondents in the final adjusted EP for SC.
[6] Exit poll results for NH derived from NYTimes Graphics Twitter publication on 6:30 PM, February 9, 2016. Accessed May 20, 2016. Available at: https://twitter.com/nytgraphics/status/697246344038256642. EP number of respondents estimated by subtracting 133 respondents (average addition of respondents in all final adjusted Democratic Party state EPs with greater than 1,000 respondents) from 2,222 respondents in the final adjusted EP for NH.
[7] Here, Wisconsin exit polls results are derived from a NBC News broadcast, on April 5, 2016 at 4:24 PM, of white vote percentages for Clinton (32%) and Sanders (68%) in early exit poll results (source: https://richardcharnin.wordpress.com/2016/04/06/a-preliminary-probability-analysis-of-the-wisconsin-primary/). The exit poll first published by CNN had white vote percentages for Clinton and Sanders at 40% and 58% respectively. All other news broadcasts, that I have documented, of early exit poll releases of demographic characteristics of voters in other primary states closely matched CNN’s first published exit polls. As Edison Research alters their exit polls to match the incoming vote counts, they may have done so here (and perhaps other states) and altered their early exit poll data to match vote totals acquired from exit poll precinct locations and or AP prior to the closing of polls in the state. Only the release of Edison’s actual exit poll data will be able to reveal the true discrepancies between their unaltered exit polls and the final unverified computer vote counts in this and other states.
[8] Here, Connecticut exit poll results come from the screenshot of a preliminary exit poll result, apparently broadcast by ABC News, showing Sanders with 55% of the vote and Clinton with 40% (source: https://richardcharnin.wordpress.com/2016/06/13/the-connecticut-primary-did-clinton-really-win/). The time of publication is not stated. If this screenshot is legitimate, ABC News, depending on the time of the broadcast, may have, perhaps unintentionally, revealed exit poll race results before the closing of polls in contradiction of the news networks’ stated policies. Again, the release of Edison’s actual detailed exit poll data would allow a determination of the true discrepancies between unaltered exit polls and the vote count.
* According to personal communication on May 23, 2016 from Mr. Lenski, Executive Vice President of Edison Research, as the National Election Pool (NEP) consisting of ABC, CBS, FOX, NBC, and the Associated Press did not provide funding to conduct exit polls for the remaining primaries, they did not occur. The remaining primaries for which no exit polls were conducted:
May 24 – Republican Party primary: Washington. June 5 – Democratic Party primary: Puerto Rico
June 7 – Democratic and Republican Party primaries: California, New Jersey, New Mexico, South Dakota, and Montana
June 14 – Democratic Party primary: District of Columbia
So let’s assume the exit polling is more accurate than the vote counts — even though as your article points out other firms have added up to 30% additional error margins to exit polls…
Then it looks like New York, Massachusetts, and Connecticut may instead have gone to Sanders,. The rest of the results would have stayed where they are. Is that what we are looking at?
I’m wondering if there is any other source to corroborate Edison Research data in at least one of these 3 states.
The margin of error (MOE) applied only only determine how many states and by how much the discrepancies exceed the Exit polls’ MOE. The table in https://tdmsresearch.com/2016/06/20/democratic-party-table-2016-primaries/ includes a MOE increased by 32% which accounts for all the possible survey errors in the exit polls.
Massachusetts, Illinois, and Missouri are the states that the exit polls projected a win for Sanders (see EP margin column with the negative sign that is relative to Clinton, and the plus sign in the vote count margin showing Clinton advantage)
The delegate totals are also impacted by the discrepancies. In my next post next week I will show that even the exit polls underestimated Sanders’ electoral strength and that he may have won considerably more states.
The main story is that the are no reasonable explanations why the exit polls were accurate in the Republican Party primaries but not in the Democratic primaries. The remaining explanation is that the unverified computer vote counts were accurate in the Republican race but not accurate with the Democratic race.
The main problem with the unverified computer vote counts is that no corroboration for the results can be found. This is a main reason Germany ditched their computers for vote counting and perform all counts in full view by hand and in public
[…] throughout nearly all of the Republican primaries, they were wildly and broadly inaccurate in the Democratic primaries, exhibiting a pervasive intra-party shift to the detriment of Sanders (i.e., Hillary Clinton’s […]
[…] data it is impossible to know if presidential candidate Sanders, for example, like in many of the 2016 state primaries did much better in this NH primary exit poll than his computer-generated vote […]